Difference between revisions of "Introduction to LabVIEW"
(1003 --> 1004) |
|||
| (115 intermediate revisions by 10 users not shown) | |||
| Line 1: | Line 1: | ||
= Objective = | |||
The experimental objective of this lab is to use LabVIEW to design a heating and cooling system and a lighting system and to test both systems. Building these systems will demonstrate the potential for using simulated instruments in a laboratory. These programs will also obtain data from outside the computer and incorporate it into a program design. | |||
< | = Overview = | ||
<!--''Adapted from Introduction to LabVIEW, Six-Hour Course.<ref name="one">''Introduction to LabVIEW, Six-Hour Course ''[Courseware]. (June 2003) Austin, TX: Worldwide Technical Support and Product Information, National Instruments Corporation</ref>''--> | |||
< | The <b>Laboratory Virtual Instrument Engineering Workbench (LabVIEW)</b> is a development environment designed by National Instruments that creates graphic-based programs called virtual instruments (VIs) that simulate actual laboratory instruments. A VI consists of two parts: a front panel and a back panel (Figure 1). The <b>front panel</b> allows the user to interact with the VI by displaying outputs and allowing the user to supply the program with inputs. The <b>back panel</b> consists of the code used by the VI to obtain inputs from the front panel, operate on the inputs, and display the results. | ||
< | |||
</ | |||
[[Image:Lab 7 Figure 1.jpg|500px|thumb|center|Figure 1: Front Panel (Left) and Back Panel (Right)]] | |||
< | The front panel is built using controls and indicators. <b>Controls</b> are inputs that allow a user to supply information to the VI. <b>Indicators</b> are outputs that display the results based on the inputs given to the VI. Controls can be switches, knobs, dials, and buttons. Indicators can be meters, gauges, LEDs, and displays. These are located on the Controls palette and are placed on the front panel (Figure 2). | ||
[[Image:Lab 7 Figure 2.jpg|225px|thumb|center|Figure 2: Controls Palette]] | |||
The back panel, which is also known as the block diagram, contains the graphic-based source code. The environment of the back panel is navigated using the <b>Tools palette</b> (Figure 3). | |||
[[Image:Lab 7 Figure 3.png|99px|frame|center|Figure 3: Tools Palette]] | |||
< | In Figure 3, only the icons in colored boxed will be used in this experiment. The <b><span style="color:red">operating tool</span></b> changes the value of a control (such as a switch or LED). The <b><span style="color:orange">positioning tool</span></b> positions, resizes, and selects objects. The <b><span style="color:green">labeling tool</span></b> is used to create and edit all labels in the VI, such as the name of a Boolean control. The <b><span style="color:blue">wiring tool</span></b> wires objects together on the back panel. The <b><span style="color:purple">scrolling tool</span></b> allows scrolling the window by clicking and dragging. | ||
<b> | All of the objects placed on the front panel will appear on the back panel as terminals. <b>Terminals</b> are the ports that exchange information between the front panel and back panel, and appear with small triangles in the icons to indicate that they can be used to process information (Figure 4). A control terminal has the triangle to the right to indicate that it sends data to be processed. An indicator terminal has the triangle to the left to indicate that it receives data. | ||
information to the | |||
[[Image:Lab 7 Figure 4.jpg|500px|frame|center|Figure 4: Control and Indicator Terminals]] | |||
The back panel also contains structures and functions that perform operations on controls and supply data to indicators. Structures and functions are found on the Functions palette and are placed on the back panel (Figure 5). | |||
[[Image:Lab 7 Figure 5.jpg|225px|thumb|center|Figure 5: Functions Palette]] | |||
< | <b>Structures</b> are process control elements, such as while loops and for loops. The structure to be used in this experiment is the <b>case structure</b> (Figure 6), which is essentially multiple if-statements. A case structure contains multiple subdiagrams (or cases), and a case will be executed depending on the input to the case structure. | ||
< | |||
[[Image:Lab 7 Figure 6.jpg|400px|thumb|center|Figure 6: Case Structure]] | |||
In Figure 6, Item 1 is the selector label, which displays the input value for which the associated case will execute. The black arrows on the side of the selector label toggle between the different cases. Item 2 is the area for the code that executes for the specific input in the selector label. When the selector label is toggled, the code in this area will also change. Item 3 is the case selector, which gives the input value to the case structure. The data type that is wired to the case selector will determine the possible cases. For example, if a Boolean data type is wired to the case selector, the possible cases will only be true and false. | |||
in | |||
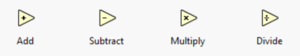
<b>Functions</b> are the fundamental operating elements of LabVIEW, and have input and output terminals to pass data in and out. They are indicated by a pale yellow background in the icon (Figure 7). | |||
[[Image:Lab 7 Figure 7.jpg|200px|thumb|center|Figure 7: Examples of Functions]] | |||
Functions have a certain number of inputs and outputs, depending on the type of function. For example, the addition function (leftmost icon in Figure 7) has two inputs as it will add the two inputs together, and it will have one output, which is the sum of the inputs. The inputs are wired to the left side of the function, and the outputs are wired to the right side of the function. The number of inputs and outputs of a function can be observed by hovering over the icon with the wiring tool and observing the terminals that appear (Figure 8). | |||
[[Image:Lab 7 Figure 8.jpg|113px|thumb|center|Figure 8: Function Terminals]] | |||
< | Collectively, controls, indicators, structures, and functions are referred to as nodes. <b>Nodes</b> are connected to one another using the wiring tool. For example, two controls and an indicator can be wired to the addition function so that the indicator displays the sum of the two controls (Figure 9). | ||
[[Image:Lab 7 Figure 9.png|226px|thumb|center|Figure 9: Wiring Nodes]] | |||
[ | |||
The <b>toolbar</b> at the top of the front panel is used to execute and stop the program (Figure 10). The run tool (white arrow) runs the program once. The run continuously tool (two white arrows in a circle) keeps the program running continuously until the program is paused or stopped. This tool should be used when executing programs in this experiment. The abort execution tool (red stop sign) stops the VI immediately. The pause button (two vertical black rectangles) pauses the program, and can be clicked again to continue the program. | |||
[[Image:Lab 7 Figure 10.png|87px|thumb|center|Figure 10: Toolbar]] | |||
[[ | |||
< | <b>National Instruments' Educational Laboratory Virtual Instrumentation Suite (NI ELVIS) board</b> (Figure 11) is one solution LabVIEW can utilize to physically interface with external devices. It is a modular engineering device that includes a breadboard, power supply, ground, thermocouple, oscilloscope, function analyzer, and other common lab instruments. In this experiment, an NI ELVIS board will be used to provide inputs and display outputs for the VIs that will be created. | ||
< | |||
[[Image:Lab 7 Figure 11.jpg|400px|thumb|center|Figure 11: NI ELVIS II+ Board]] | |||
= Materials and Equipment = | |||
* Lab PC | |||
* LabVIEW 2019 software | |||
* NI ELVIS II+ prototyping board | |||
* Wires | |||
* Two 100 kΩ resistors (brown, black, yellow) | |||
= Procedure = | |||
Note: Some tasks will be repeated and the same icons will be used. A LabVIEW digest of common tasks at the bottom of the page contains references for faster navigation. | |||
== Setting up a Blank VI == | |||
# Open LabVIEW and select Blank VI under Create Project. | |||
# Click Window > Tile Left and Right to display the front panel (left window) and back panel (right window) side by side. This will make them visible at the same time, making it easier to work. | |||
# With the back panel selected, click View > Tools Palette to open the Tools palette. | |||
# With the front panel selected, click View > Controls Palette. The workspace should look like Figure 12. To open the Controls palette in the future, simply right click in the front panel. Similarly, to open the Functions palette, simply right click in the back panel. | |||
[[Image:lab_labview_1.png|thumb|500px|center|Figure 12: LabVIEW Workspace]] | |||
For help with the operation of any LabVIEW icon, select Help > Show Context Help > click the icon for the operation that is unclear. It will be explained in the Context Help window. | |||
in | |||
the | |||
== 1. Heating and Cooling System == | |||
Build a VI that simulates a heating and cooling system. The system must be able to be controlled manually or automatically. The VI’s specifications are listed below. | |||
* Must be able to be controlled automatically or manually | |||
* In manual mode, the heater and air conditioning (AC) can be switched on/off by the user | |||
* In automatic mode, the heater and AC turn on/off based on the following conditions: | |||
** The air conditioner is turned on when the temperature is above 80°F | |||
** The heater is turned on when the temperature is below 60°F | |||
** The heater and the air conditioner are turned off when the temperature is between 60°F and 80°F | |||
# In the front panel, drag and drop three Round LEDs and three Slide Switches by going to the Controls palette > Modern tab > Boolean (Figure 13). Each round LED and each slide switch will represent the AC, heater, and manual mode. The round LEDs will indicate if the item is on, and the slide switches will toggle the items on/off. | |||
#: [[Image:Switches.PNG|thumb|400px|center|Figure 13: Slide Switches and Round LEDs in the Controls Palette]] | |||
it in | # Rename the LEDs and their corresponding switches "Manual," "AC," and "Heater" to make building the system clearer (Figure 14). This can be done by using the editing text tool in the Tools palette. | ||
#: [[Image:Code_switches_leds.PNG|thumb|400px|center|Figure 14: Named Switches and LEDs in the Front Panel]] | |||
# Drag and drop a thermometer (Figure 15) into the front panel (Controls palette > Modern tab > Numeric > Thermometer). | |||
#: [[Image:thermometer.PNG|thumb|400px|center|Figure 15: Thermometer Control]] | |||
# In the back panel, right click the thermometer terminal and select Change to Control, and observe how the arrow switches from the left side to the right side (Figure 16). This makes the thermometer a control that will give an input to the program, which in this case is temperature. | |||
#: [[Image:control_vs_indicator.PNG|thumb|400px|center|Figure 16: Indicator (Left) vs Control (Right)]] | |||
# In the back panel, insert a case structure to control the manual and automatic operation of the heating and cooling system (Functions palette > Structures > Case Structure). To place the case structure, click once to place one corner of the case structure, and once more to place the other corner of the case structure (Figure 17). | |||
#: [[Image:Lab 7 Figure 17.PNG|thumb|400px|center|Figure 17: Case Structure]] | |||
# Wire the slide switch designated as Manual to the case selector on the case structure (Figure 18). This should automatically change the selector label values to True and False, if they were not already, because the slide switch is a Boolean data type. The true value corresponds to manual mode being on (where the user can directly toggle the heater and AC), while the false value corresponds to manual mode being off (where the heater and AC are automatically toggled by the system). | |||
#: [[Image:Case_structure_wired.PNG|thumb|400px|center|Figure 18: Manual Switch as Case Selector]] | |||
# Because the temperature of the room is input into the system only when the system is not in manual mode (the false case), the thermometer terminal should be moved into the false subdiagram (Figure 19). | |||
#: [[Image:Thermometer_in_structure.PNG|thumb|400px|center|Figure 19: Thermometer in the False Subdiagram]] | |||
# In the true subdiagram, wire the AC and heater switches directly to their corresponding LEDs (Figure 20). This allows the switches to directly toggle their corresponding LEDs. | |||
#: [[Image:Lab 7 Figure 20.PNG|thumb|400px|center|Figure 20: Wiring the Switches to the LEDs]] | |||
# Staying in the true subdiagram, insert a True Constant (Functions palette > Programming tab > Boolean > True Constant). Wire the true constant to the manual LED to turn the manual LED on and indicate that the system is in manual mode (Figure 21). | |||
#: [[Image:Lab 7 Figure 21.PNG|thumb|400px|center|Figure 21: Subdiagram for True Case]] | |||
# In the false subdiagram, insert two Numeric Constants (Functions palette > Programming > Numeric > Numeric Constant), one Greater? function and one Less? function (Functions palette > Programming > Comparison). These will be used to build the program for the heating and cooling system in automatic mode (Figure 22). | |||
#: [[Image:Lab 7 Figure 22.PNG|thumb|400px|center|Figure 22: Terminals for False Subdiagram]] | |||
# The less and greater functions compare what is wired to the upper input terminal to what is wired to the lower input terminal. Wire the thermometer to the upper input terminals of the less and greater functions. Set a numeric constant to 60 and the other to 80. Wire the 60 numeric constant to the lower input terminal of the less function and the 80 numeric constant to the lower input terminal of the greater function. Wire the output terminal of the greater function to the AC LED and wire the output of the less function to the heater LED (Figure 23). | |||
#: [[Image:Lab 7 Figure 23.PNG|thumb|400px|center|Figure 23: Wiring to Heater and AC LEDs]] | |||
# In the false subdiagram, Insert a False Constant (Functions palette > Programming > Boolean > False Constant) and wire it to the manual LED (Figure 24). This is to turn off the manual LED and indicate that the system is in automatic mode. | |||
#: [[Image:Lab 7 Figure 24.PNG|thumb|400px|center|Figure 24: Subdiagram for False Case]] | |||
# The system is now complete. Click the continuously run button to control and test the VI. If the continuously run button is faded out, that means the system is wired completely. When successfully running the system, the gridlines in the background of the front panel should disappear (Figure 25). Click the switches and thermometer on the front panel to test the system. | |||
#: [[Image:Lab 7 Figure 25.PNG|thumb|400px|center|Figure 25: Running Heating and Cooling System]] | |||
# Have a TA check the VI. Once testing is complete, take a screenshot of the VI. Save the heating and cooling system as a VI file (saving the file will save both the front panel and back panel in one file). Send the VI file to you and your teammates via email. | |||
== Interfacing with a Heat Cube == | |||
< | The VI will now be altered to interact with a <b>heat cube</b>, which is a physical device that houses a heating element, a fan, and a thermocouple, and LEDs located on an NI ELVIS board. The heat cube will take the ambient temperature of the room and input it into the heating and cooling system. The fan (i.e. the AC) and heater in the heat cube can be turned on/off manually or automatically using the heating and cooling VI that was just created. This will be done by uploading pre-written sub-VIs that will interface the heating and cooling VI with the circuit on the NI ELVIS board. | ||
# [[Media:Sub-VIs.zip | Download the sub-VIs onto the desktop.]] Unzip the folder. There should be three sub-VIs – Cooling Control.vi, Heat Control.vi, and Temp Reading.vi. | |||
# Insert the sub-VIs into the back panel by right-clicking on the back panel > Select a VI… > click the sub-VI. Click on the back panel outside of the case structure to place the sub-VIs. They should appear as small boxes with text and an icon (Figure 26). | |||
#: [[Image:Lab 7 Figure 26.PNG|thumb|center|Figure 26: Sub-VI Terminals]] | |||
# In the automatic subdiagram, wire the output tunnel (green box along the border of the case structure) of the less function to the input terminal of the Heat Control sub-VI labeled Heat. Wire the output tunnel of the greater function to the input terminal of the Cool Control sub-VI labeled Cooling. | |||
# Delete the orange wiring from the thermometer terminal to the upper input terminals of the less and greater comparison functions. Wire the output terminal of the Temp Reading sub-VI labeled Result to the upper input terminals of the comparison functions. The Temp Reading sub-VI will effectively replace the thermometer control terminal. | |||
# Change the thermometer node to an indicator similarly to how it was earlier changed to a control. | |||
# Wire the Result output terminal on the Temp Reading sub-VI to the thermometer indicator terminal. The thermometer indicator terminal will be used to display the temperature being read by the thermocouple in the heat cube. | |||
# A device constant must be defined for each of the pre-written sub-VIs. The device constant selects the external device the sub-VIs transmit data to and receive data from, similar to selecting a port for an Arduino program. | |||
# With the wiring tool selected, right click on the input terminal of the sub-VIs labeled Device Name > Create > Constant. | |||
# Verify that all three device constants are equivalent. The device constant can be changed using the operating tool in the Tools palette. | |||
# Ask the TA to check over the modifications to the VI. If correct, the TA will supply an NI ELVIS board, a heat cube, two 100 kΩ resistors, and electrical wires. | |||
# Using two 100 kΩ resistors (Brown, Black, Yellow), insert one end of each resistor into AIGND (row 18) of the NI ELVIS board. | |||
# Insert the other end of one of the resistors into the AI 7+ (row 15), and the end of the other resistor into AI 7- (row 16). | |||
# Using a wire, connect the AI 7+ port (row 15) to the screw terminal 1 port (row 46). | |||
# Using a wire, connect the AI 7- port (row 16) to the screw terminal 2 port (row 47). | |||
# Insert the positive and negative wires from the fan into Variable Power Supplies SUPPLY+ (row 48) and Variable Power Supplies GROUND (row 49), respectively, at the lower-left-hand corner of the NI ELVIS board. | |||
# Connect the positive wire from the heater to DC +5V (row 54) on the lower-right-hand corner of the NI ELVIS board. | |||
# Connect the source of the MOSFET from the heat cube circuit to DC ground (row 53) on the lower-right-hand corner of the NI ELVIS board. | |||
# Connect the gate of the MOSFET from the heat cube circuit to DIO 19 (row 20) on the upper-right-hand corner of the NI ELVIS board. | |||
# Power the NI ELVIS board with the power cable and also connect it to the PC with the USB cable. The device constants on the back panel of the VI should update to reference the NI ELVIS board. | |||
# Run the VI. Observe how the fan and heater in the heat cube can be turned on manually and automatically. Observe how the thermometer indicator in the front panel displays the actual temperature of the room. | |||
== 2. Lighting System == | |||
Build a VI that simulates a lighting system in a house with four rooms. The design must use four lights (LEDs) and at least five switches — one switch per light and one master switch that will turn all of the lights off simultaneously (think of this as a circuit breaker). The program should also interact with real LEDs located on the NI ELVIS board. | |||
< | # The front panel of the program should use five switches and four LEDs. | ||
< | # The back panel requires a case structure for the master switch to turn off all the lights. Think of the cases that will be required for the function of the master switch. | ||
# Create the program in the case structure using the appropriate functions and wiring. Use knowledge acquired from creating the heating and cooling system, information from the Overview, and the LabVIEW Digest at the bottom of the page. | |||
# After completing the program, the VI must be interfaced to the physical NI ELVIS board. The VI is interfaced to the NI ELVIS board using a function called the Digital Writer, which writes data to the DIO (Digital Input and Output) pins on the board, and can display outputs on the board’s built-in LEDs from the VI. To access the Digital Writer node, go to the Functions palette > Measurement I/O tab > NI ELVISmx > Digital Writer (Figure 27). Place the Digital Writer node on the back panel. | |||
#: [[Image:Lab 7 Figure 27.png|225px|frame|center|Figure 27: NI ELVISmx Digital Writer]] | |||
# Hover over the blue square at the bottom of the Digital Writer node, click, and drag down. Six colored lines should appear (Figure 28). If this cannot be performed, double click on the Digital Writer node and click OK in the NI ELVISmx dialog that pops up. Try to expand the node again. | |||
#: [[Image:Lab 7 Figure 28.png|frame|center|Figure 28: NI ELVISmx Digital Writer Node]] | |||
# Only two of the lines in the Digital Writer node will be used in this experiment. The <b>Lines to Write</b> determine which group of eight DIO pins will be used in the VI. The Lines to Write come in groups of eight (starting at 0) because the program works in 8-bit. The <b>DO (Digital Output) Lines</b> input the Boolean values into the DIO pins. | |||
# For the purposes of this lab, DIO lines 0–7 will be utilized (Figure 29). To establish this setting, right-click Lines to Write on the Digital Writer node > Create > Constant. By default, the constant is set to 0–7. The operating tool in the Tools palette can be used to change this value. | |||
#: [[Image:Lab 7 Figure 29.png|145px|frame|center|Figure 29: Lines to Write]] | |||
# The DO Lines require an input for each of the eight DIO lines, indicating whether each one is true or false (on or off), but the Digital Writer can only receive one input for the DO Lines (as observed by the one input terminal for the DO Lines on the Digital Writer node). Therefore, the eight Boolean values will be placed in an array, and the array will be input to the DO Lines. | |||
# A Build Array function will be used by going to the Functions palette > Programming > Build Array (Figure 30). The array should be eight indices long to represent each DIO line. When first placing the array, it only appears as one index. Hover over the bottom of the array until a two-sided arrow appears, then click and drag down until the array is eight indices long. | |||
#: [[Image:Lab 7 Figure 30.png|225px|frame|center|Figure 30: Array Function]] | |||
# Each LED should be wired to an individual index in the array, at the element terminal on the left side of the array node. The remaining four indices in the array should be wired to false constants, as those DIO lines should remain false at all times as they are not in use. | |||
# The resulting array should be wired to the Lines to Write of the Digital Writer node, from the appended array terminal on the right side of the array node (Figure 31). | |||
#: [[Image:Lab 7 Figure 31.png|145px|frame|center|Figure 31: Completed Digital Writer Node]] | |||
# For the LEDs on the NI ELVIS board to light up, wires must be used to connect the DIO lines (rows 0–7) directly to the LEDs on the NI ELVIS board (rows 35–42). | |||
# Test the VI. Double click the Digital Writer node. Ensure the correct Device and Lines to Write are selected under Configuration of the NI ELVISmx dialog. Click OK. Run the VI in LabVIEW. Ask a TA to check the program. | |||
# Take screenshots of the lighting system. Save the lighting system as a VI file. | |||
# Submit a ZIP file of both the heating and cooling system and the lighting system to the EG1004 website before 11:59PM the night before the next lab. | |||
The lab work is now complete. Please clean up the workstation. Return all unused materials to the TA. Refer to the Assignment section for the instructions needed to prepare the lab report. | |||
= Assignment = | |||
<b><span style="color:red">A ZIP folder containing both LabVIEW programs (in VI format) must be submitted to the [http://eg.poly.edu EG1004 Website] by 11:59PM the night before the next lab. There is no Team PowerPoint Presentation for this lab.</span></b> | |||
== Team Lab Report == | |||
{{Labs:Lab Report}} | |||
* How is LabVIEW important today? | |||
* Explain what LabVIEW is and describe how it helps engineers and scientists with their work | |||
* Explain what a VI is | |||
* What are controls and indicators? | |||
* What are structures and functions? | |||
* What is the front panel used for? The back panel? | |||
* Discuss what an NI ELVIS board is | |||
* State whether the VIs were successful or not. If not, explain why. | |||
* State whether interfacing the VIs with the NI ELVIS board was successful or not | |||
* Describe the advantages and disadvantages of using LabVIEW | |||
* Suggest some improvements for the lab procedure | |||
* Suggest improvements for each VI | |||
* Because the procedural elements in this lab are extensive, please include only the procedures employed to build the lighting system in the lab report. Do not document the procedures followed to build the heating and cooling system | |||
* Though the Procedure section is limited to the lighting system, discuss both of the designs in the Data/Observations and Conclusion sections of the lab report | |||
* Please consider the value of LabVIEW as a substitute for actual instruments and systems. The Data/Observations section should include information on ease of use, the LabVIEW user interface, and the available help options | |||
* In describing the design of all the systems, present screenshots in the lab reports showing the VIs that were designed | |||
{{Labs:Lab Notes}} | |||
< | <!-- | ||
== Team PowerPoint Presentation (EGED I Only) == | |||
Follow the presentation guidelines laid out in the page called [[EG1004 Lab Presentation Format]] in the ''Introduction to Technical Presentations'' section of this manual. When preparing the presentation, consider the following points: | |||
* What is the importance of LabVIEW? | |||
* Discuss some ways LabVIEW can be used in industry. | |||
--> | |||
= LabVIEW Digest of Common Tasks = | |||
== Front Panel == | |||
* <b>How to get a slide control:</b> | |||
** Controls palette > Modern tab > Numeric [[Image:lab_labview_2.png]] | |||
** Select Horizontal Pointer Slide [[Image:Slide Control 2.png|55px]] | |||
the | ** Click on the front panel to place the slide at a specific location | ||
< | * <b>How to get an LED indicator:</b> | ||
** Controls palette > Modern tab > Boolean [[Image:lab_labview_8.png]] | |||
** Select the Round LED [[File:LED 1.png|55px]] or Square LED [[File:LED 2.png|55px]] | |||
** Click on the front panel to place the LED at a specific location | |||
< | * <b>How to get a numeric control:</b> | ||
** Controls palette > Modern tab > Numeric [[Image:lab_labview_2.png]] | |||
** Click on Numeric Control [[Image:NC.png|55px]] | |||
** Click on the front panel to place the numeric control at a specific location | |||
< | * <b>How to get a numeric indicator:</b> | ||
< | ** Controls palette > Modern tab > Numeric [[Image:lab_labview_2.png]] | ||
** Click on Numeric Indicator [[Image:NI.png|55px]] | |||
** Click on the front panel to place the numeric indicator at a specific location | |||
== Back Panel == | |||
* <b>How to define an arithmetic operation:</b> | |||
** Functions palette > Programming tab > Numeric [[Image:lab_labview_33.png]] | |||
** Click on the function of the desired arithmetic operation [[Image:Arithmetic.png|300px]] | |||
** Click on the back panel to place the arithmetic function at a specific location | |||
< | * <b>How to define Boolean constants (usually used to turn on/off LEDs):</b> | ||
** Functions palette > Programming tab > Boolean [[Image:lab_labview_36.png]] | |||
** Click on the True Constant [[Image:lab_labview_42.png]] or False Constant [[Image:lab_labview_43.png]] | |||
** Click on the back panel to place the Boolean constant at a specific location | |||
< | * <b>How to wire:</b> | ||
** Tools palette > Wiring tool [[Image:lab_labview_19.png]] | |||
** Click the desired object output terminal (on the left side) to wire from | |||
** Click the desired object input terminal (on the right side) to wire to | |||
= References = | |||
Introduction to LabVIEW, Six-Hour Course [Courseware]. (June 2003) Austin, TX: Worldwide Technical Support and Product Information, National Instruments Corporation. | |||
“LabVIEW Block Diagram Explained.” National Instruments, National Instruments, 4 Feb. 2020, www.ni.com/en-us/support/documentation/supplemental/08/labview-block-diagram-explained.html. | |||
“Case Structure.” National Instruments, National Instruments, 4 Feb. 2020, www.zone.ni.com/reference/en-XX/help/371361R-01/glang/case_structure/. | |||
“LabVIEW Front Panel Explained.” National Instruments, National Instruments, 4 Feb. 2020, www.ni.com/en-us/support/documentation/supplemental/08/labview-front-panel-explained.html. | |||
{{Laboratory Experiments}} | |||
Latest revision as of 02:30, 31 August 2022
Objective
The experimental objective of this lab is to use LabVIEW to design a heating and cooling system and a lighting system and to test both systems. Building these systems will demonstrate the potential for using simulated instruments in a laboratory. These programs will also obtain data from outside the computer and incorporate it into a program design.
Overview
The Laboratory Virtual Instrument Engineering Workbench (LabVIEW) is a development environment designed by National Instruments that creates graphic-based programs called virtual instruments (VIs) that simulate actual laboratory instruments. A VI consists of two parts: a front panel and a back panel (Figure 1). The front panel allows the user to interact with the VI by displaying outputs and allowing the user to supply the program with inputs. The back panel consists of the code used by the VI to obtain inputs from the front panel, operate on the inputs, and display the results.

The front panel is built using controls and indicators. Controls are inputs that allow a user to supply information to the VI. Indicators are outputs that display the results based on the inputs given to the VI. Controls can be switches, knobs, dials, and buttons. Indicators can be meters, gauges, LEDs, and displays. These are located on the Controls palette and are placed on the front panel (Figure 2).

The back panel, which is also known as the block diagram, contains the graphic-based source code. The environment of the back panel is navigated using the Tools palette (Figure 3).

In Figure 3, only the icons in colored boxed will be used in this experiment. The operating tool changes the value of a control (such as a switch or LED). The positioning tool positions, resizes, and selects objects. The labeling tool is used to create and edit all labels in the VI, such as the name of a Boolean control. The wiring tool wires objects together on the back panel. The scrolling tool allows scrolling the window by clicking and dragging.
All of the objects placed on the front panel will appear on the back panel as terminals. Terminals are the ports that exchange information between the front panel and back panel, and appear with small triangles in the icons to indicate that they can be used to process information (Figure 4). A control terminal has the triangle to the right to indicate that it sends data to be processed. An indicator terminal has the triangle to the left to indicate that it receives data.

The back panel also contains structures and functions that perform operations on controls and supply data to indicators. Structures and functions are found on the Functions palette and are placed on the back panel (Figure 5).

Structures are process control elements, such as while loops and for loops. The structure to be used in this experiment is the case structure (Figure 6), which is essentially multiple if-statements. A case structure contains multiple subdiagrams (or cases), and a case will be executed depending on the input to the case structure.

In Figure 6, Item 1 is the selector label, which displays the input value for which the associated case will execute. The black arrows on the side of the selector label toggle between the different cases. Item 2 is the area for the code that executes for the specific input in the selector label. When the selector label is toggled, the code in this area will also change. Item 3 is the case selector, which gives the input value to the case structure. The data type that is wired to the case selector will determine the possible cases. For example, if a Boolean data type is wired to the case selector, the possible cases will only be true and false.
Functions are the fundamental operating elements of LabVIEW, and have input and output terminals to pass data in and out. They are indicated by a pale yellow background in the icon (Figure 7).

Functions have a certain number of inputs and outputs, depending on the type of function. For example, the addition function (leftmost icon in Figure 7) has two inputs as it will add the two inputs together, and it will have one output, which is the sum of the inputs. The inputs are wired to the left side of the function, and the outputs are wired to the right side of the function. The number of inputs and outputs of a function can be observed by hovering over the icon with the wiring tool and observing the terminals that appear (Figure 8).

Collectively, controls, indicators, structures, and functions are referred to as nodes. Nodes are connected to one another using the wiring tool. For example, two controls and an indicator can be wired to the addition function so that the indicator displays the sum of the two controls (Figure 9).

The toolbar at the top of the front panel is used to execute and stop the program (Figure 10). The run tool (white arrow) runs the program once. The run continuously tool (two white arrows in a circle) keeps the program running continuously until the program is paused or stopped. This tool should be used when executing programs in this experiment. The abort execution tool (red stop sign) stops the VI immediately. The pause button (two vertical black rectangles) pauses the program, and can be clicked again to continue the program.
National Instruments' Educational Laboratory Virtual Instrumentation Suite (NI ELVIS) board (Figure 11) is one solution LabVIEW can utilize to physically interface with external devices. It is a modular engineering device that includes a breadboard, power supply, ground, thermocouple, oscilloscope, function analyzer, and other common lab instruments. In this experiment, an NI ELVIS board will be used to provide inputs and display outputs for the VIs that will be created.

Materials and Equipment
- Lab PC
- LabVIEW 2019 software
- NI ELVIS II+ prototyping board
- Wires
- Two 100 kΩ resistors (brown, black, yellow)
Procedure
Note: Some tasks will be repeated and the same icons will be used. A LabVIEW digest of common tasks at the bottom of the page contains references for faster navigation.
Setting up a Blank VI
- Open LabVIEW and select Blank VI under Create Project.
- Click Window > Tile Left and Right to display the front panel (left window) and back panel (right window) side by side. This will make them visible at the same time, making it easier to work.
- With the back panel selected, click View > Tools Palette to open the Tools palette.
- With the front panel selected, click View > Controls Palette. The workspace should look like Figure 12. To open the Controls palette in the future, simply right click in the front panel. Similarly, to open the Functions palette, simply right click in the back panel.

For help with the operation of any LabVIEW icon, select Help > Show Context Help > click the icon for the operation that is unclear. It will be explained in the Context Help window.
1. Heating and Cooling System
Build a VI that simulates a heating and cooling system. The system must be able to be controlled manually or automatically. The VI’s specifications are listed below.
- Must be able to be controlled automatically or manually
- In manual mode, the heater and air conditioning (AC) can be switched on/off by the user
- In automatic mode, the heater and AC turn on/off based on the following conditions:
- The air conditioner is turned on when the temperature is above 80°F
- The heater is turned on when the temperature is below 60°F
- The heater and the air conditioner are turned off when the temperature is between 60°F and 80°F
- In the front panel, drag and drop three Round LEDs and three Slide Switches by going to the Controls palette > Modern tab > Boolean (Figure 13). Each round LED and each slide switch will represent the AC, heater, and manual mode. The round LEDs will indicate if the item is on, and the slide switches will toggle the items on/off.
- Rename the LEDs and their corresponding switches "Manual," "AC," and "Heater" to make building the system clearer (Figure 14). This can be done by using the editing text tool in the Tools palette.
- Drag and drop a thermometer (Figure 15) into the front panel (Controls palette > Modern tab > Numeric > Thermometer).
- In the back panel, right click the thermometer terminal and select Change to Control, and observe how the arrow switches from the left side to the right side (Figure 16). This makes the thermometer a control that will give an input to the program, which in this case is temperature.
- In the back panel, insert a case structure to control the manual and automatic operation of the heating and cooling system (Functions palette > Structures > Case Structure). To place the case structure, click once to place one corner of the case structure, and once more to place the other corner of the case structure (Figure 17).
- Wire the slide switch designated as Manual to the case selector on the case structure (Figure 18). This should automatically change the selector label values to True and False, if they were not already, because the slide switch is a Boolean data type. The true value corresponds to manual mode being on (where the user can directly toggle the heater and AC), while the false value corresponds to manual mode being off (where the heater and AC are automatically toggled by the system).
- Because the temperature of the room is input into the system only when the system is not in manual mode (the false case), the thermometer terminal should be moved into the false subdiagram (Figure 19).
- In the true subdiagram, wire the AC and heater switches directly to their corresponding LEDs (Figure 20). This allows the switches to directly toggle their corresponding LEDs.
- Staying in the true subdiagram, insert a True Constant (Functions palette > Programming tab > Boolean > True Constant). Wire the true constant to the manual LED to turn the manual LED on and indicate that the system is in manual mode (Figure 21).
- In the false subdiagram, insert two Numeric Constants (Functions palette > Programming > Numeric > Numeric Constant), one Greater? function and one Less? function (Functions palette > Programming > Comparison). These will be used to build the program for the heating and cooling system in automatic mode (Figure 22).
- The less and greater functions compare what is wired to the upper input terminal to what is wired to the lower input terminal. Wire the thermometer to the upper input terminals of the less and greater functions. Set a numeric constant to 60 and the other to 80. Wire the 60 numeric constant to the lower input terminal of the less function and the 80 numeric constant to the lower input terminal of the greater function. Wire the output terminal of the greater function to the AC LED and wire the output of the less function to the heater LED (Figure 23).
- In the false subdiagram, Insert a False Constant (Functions palette > Programming > Boolean > False Constant) and wire it to the manual LED (Figure 24). This is to turn off the manual LED and indicate that the system is in automatic mode.
- The system is now complete. Click the continuously run button to control and test the VI. If the continuously run button is faded out, that means the system is wired completely. When successfully running the system, the gridlines in the background of the front panel should disappear (Figure 25). Click the switches and thermometer on the front panel to test the system.
- Have a TA check the VI. Once testing is complete, take a screenshot of the VI. Save the heating and cooling system as a VI file (saving the file will save both the front panel and back panel in one file). Send the VI file to you and your teammates via email.


Interfacing with a Heat Cube
The VI will now be altered to interact with a heat cube, which is a physical device that houses a heating element, a fan, and a thermocouple, and LEDs located on an NI ELVIS board. The heat cube will take the ambient temperature of the room and input it into the heating and cooling system. The fan (i.e. the AC) and heater in the heat cube can be turned on/off manually or automatically using the heating and cooling VI that was just created. This will be done by uploading pre-written sub-VIs that will interface the heating and cooling VI with the circuit on the NI ELVIS board.
- Download the sub-VIs onto the desktop. Unzip the folder. There should be three sub-VIs – Cooling Control.vi, Heat Control.vi, and Temp Reading.vi.
- Insert the sub-VIs into the back panel by right-clicking on the back panel > Select a VI… > click the sub-VI. Click on the back panel outside of the case structure to place the sub-VIs. They should appear as small boxes with text and an icon (Figure 26).
- In the automatic subdiagram, wire the output tunnel (green box along the border of the case structure) of the less function to the input terminal of the Heat Control sub-VI labeled Heat. Wire the output tunnel of the greater function to the input terminal of the Cool Control sub-VI labeled Cooling.
- Delete the orange wiring from the thermometer terminal to the upper input terminals of the less and greater comparison functions. Wire the output terminal of the Temp Reading sub-VI labeled Result to the upper input terminals of the comparison functions. The Temp Reading sub-VI will effectively replace the thermometer control terminal.
- Change the thermometer node to an indicator similarly to how it was earlier changed to a control.
- Wire the Result output terminal on the Temp Reading sub-VI to the thermometer indicator terminal. The thermometer indicator terminal will be used to display the temperature being read by the thermocouple in the heat cube.
- A device constant must be defined for each of the pre-written sub-VIs. The device constant selects the external device the sub-VIs transmit data to and receive data from, similar to selecting a port for an Arduino program.
- With the wiring tool selected, right click on the input terminal of the sub-VIs labeled Device Name > Create > Constant.
- Verify that all three device constants are equivalent. The device constant can be changed using the operating tool in the Tools palette.
- Ask the TA to check over the modifications to the VI. If correct, the TA will supply an NI ELVIS board, a heat cube, two 100 kΩ resistors, and electrical wires.
- Using two 100 kΩ resistors (Brown, Black, Yellow), insert one end of each resistor into AIGND (row 18) of the NI ELVIS board.
- Insert the other end of one of the resistors into the AI 7+ (row 15), and the end of the other resistor into AI 7- (row 16).
- Using a wire, connect the AI 7+ port (row 15) to the screw terminal 1 port (row 46).
- Using a wire, connect the AI 7- port (row 16) to the screw terminal 2 port (row 47).
- Insert the positive and negative wires from the fan into Variable Power Supplies SUPPLY+ (row 48) and Variable Power Supplies GROUND (row 49), respectively, at the lower-left-hand corner of the NI ELVIS board.
- Connect the positive wire from the heater to DC +5V (row 54) on the lower-right-hand corner of the NI ELVIS board.
- Connect the source of the MOSFET from the heat cube circuit to DC ground (row 53) on the lower-right-hand corner of the NI ELVIS board.
- Connect the gate of the MOSFET from the heat cube circuit to DIO 19 (row 20) on the upper-right-hand corner of the NI ELVIS board.
- Power the NI ELVIS board with the power cable and also connect it to the PC with the USB cable. The device constants on the back panel of the VI should update to reference the NI ELVIS board.
- Run the VI. Observe how the fan and heater in the heat cube can be turned on manually and automatically. Observe how the thermometer indicator in the front panel displays the actual temperature of the room.

2. Lighting System
Build a VI that simulates a lighting system in a house with four rooms. The design must use four lights (LEDs) and at least five switches — one switch per light and one master switch that will turn all of the lights off simultaneously (think of this as a circuit breaker). The program should also interact with real LEDs located on the NI ELVIS board.
- The front panel of the program should use five switches and four LEDs.
- The back panel requires a case structure for the master switch to turn off all the lights. Think of the cases that will be required for the function of the master switch.
- Create the program in the case structure using the appropriate functions and wiring. Use knowledge acquired from creating the heating and cooling system, information from the Overview, and the LabVIEW Digest at the bottom of the page.
- After completing the program, the VI must be interfaced to the physical NI ELVIS board. The VI is interfaced to the NI ELVIS board using a function called the Digital Writer, which writes data to the DIO (Digital Input and Output) pins on the board, and can display outputs on the board’s built-in LEDs from the VI. To access the Digital Writer node, go to the Functions palette > Measurement I/O tab > NI ELVISmx > Digital Writer (Figure 27). Place the Digital Writer node on the back panel.
 Figure 27: NI ELVISmx Digital Writer
- Hover over the blue square at the bottom of the Digital Writer node, click, and drag down. Six colored lines should appear (Figure 28). If this cannot be performed, double click on the Digital Writer node and click OK in the NI ELVISmx dialog that pops up. Try to expand the node again.
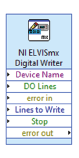 Figure 28: NI ELVISmx Digital Writer Node
- Only two of the lines in the Digital Writer node will be used in this experiment. The Lines to Write determine which group of eight DIO pins will be used in the VI. The Lines to Write come in groups of eight (starting at 0) because the program works in 8-bit. The DO (Digital Output) Lines input the Boolean values into the DIO pins.
- For the purposes of this lab, DIO lines 0–7 will be utilized (Figure 29). To establish this setting, right-click Lines to Write on the Digital Writer node > Create > Constant. By default, the constant is set to 0–7. The operating tool in the Tools palette can be used to change this value.
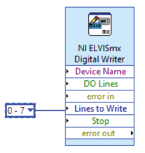 Figure 29: Lines to Write
- The DO Lines require an input for each of the eight DIO lines, indicating whether each one is true or false (on or off), but the Digital Writer can only receive one input for the DO Lines (as observed by the one input terminal for the DO Lines on the Digital Writer node). Therefore, the eight Boolean values will be placed in an array, and the array will be input to the DO Lines.
- A Build Array function will be used by going to the Functions palette > Programming > Build Array (Figure 30). The array should be eight indices long to represent each DIO line. When first placing the array, it only appears as one index. Hover over the bottom of the array until a two-sided arrow appears, then click and drag down until the array is eight indices long.
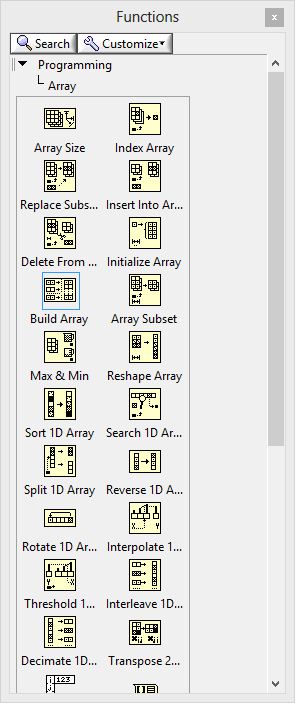 Figure 30: Array Function
- Each LED should be wired to an individual index in the array, at the element terminal on the left side of the array node. The remaining four indices in the array should be wired to false constants, as those DIO lines should remain false at all times as they are not in use.
- The resulting array should be wired to the Lines to Write of the Digital Writer node, from the appended array terminal on the right side of the array node (Figure 31).
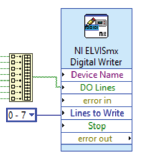 Figure 31: Completed Digital Writer Node
- For the LEDs on the NI ELVIS board to light up, wires must be used to connect the DIO lines (rows 0–7) directly to the LEDs on the NI ELVIS board (rows 35–42).
- Test the VI. Double click the Digital Writer node. Ensure the correct Device and Lines to Write are selected under Configuration of the NI ELVISmx dialog. Click OK. Run the VI in LabVIEW. Ask a TA to check the program.
- Take screenshots of the lighting system. Save the lighting system as a VI file.
- Submit a ZIP file of both the heating and cooling system and the lighting system to the EG1004 website before 11:59PM the night before the next lab.


The lab work is now complete. Please clean up the workstation. Return all unused materials to the TA. Refer to the Assignment section for the instructions needed to prepare the lab report.
Assignment
A ZIP folder containing both LabVIEW programs (in VI format) must be submitted to the EG1004 Website by 11:59PM the night before the next lab. There is no Team PowerPoint Presentation for this lab.
Team Lab Report
Follow the lab report guidelines laid out in the EG1004 Writing Style Guide in the Technical Writing section of the manual. Use the outline below to write this report.
- How is LabVIEW important today?
- Explain what LabVIEW is and describe how it helps engineers and scientists with their work
- Explain what a VI is
- What are controls and indicators?
- What are structures and functions?
- What is the front panel used for? The back panel?
- Discuss what an NI ELVIS board is
- State whether the VIs were successful or not. If not, explain why.
- State whether interfacing the VIs with the NI ELVIS board was successful or not
- Describe the advantages and disadvantages of using LabVIEW
- Suggest some improvements for the lab procedure
- Suggest improvements for each VI
- Because the procedural elements in this lab are extensive, please include only the procedures employed to build the lighting system in the lab report. Do not document the procedures followed to build the heating and cooling system
- Though the Procedure section is limited to the lighting system, discuss both of the designs in the Data/Observations and Conclusion sections of the lab report
- Please consider the value of LabVIEW as a substitute for actual instruments and systems. The Data/Observations section should include information on ease of use, the LabVIEW user interface, and the available help options
- In describing the design of all the systems, present screenshots in the lab reports showing the VIs that were designed
Remember: Lab notes must be taken. Experimental details are easily forgotten unless written down. EG1004 Lab Notes paper can be downloaded and printed from the EG1004 Website. Use the lab notes to write the Procedure section of the lab report. At the end of each lab, a TA will scan the lab notes and upload them to the Lab Documents section of the EG1004 Website. One point of extra credit is awarded if the lab notes are attached at the end of the lab report. Keeping careful notes is an essential component of all scientific practice.
LabVIEW Digest of Common Tasks
Front Panel
- How to get a slide control:
- Controls palette > Modern tab > Numeric

- Select Horizontal Pointer Slide

- Click on the front panel to place the slide at a specific location
- Controls palette > Modern tab > Numeric


- How to get an LED indicator:
- Controls palette > Modern tab > Boolean

- Select the Round LED
 or Square LED
- Click on the front panel to place the LED at a specific location
- Controls palette > Modern tab > Boolean

- How to get a numeric control:
- Controls palette > Modern tab > Numeric
- Click on Numeric Control

- Click on the front panel to place the numeric control at a specific location
- Controls palette > Modern tab > Numeric
- How to get a numeric indicator:
- Controls palette > Modern tab > Numeric
- Click on Numeric Indicator

- Click on the front panel to place the numeric indicator at a specific location
- Controls palette > Modern tab > Numeric

Back Panel
- How to define an arithmetic operation:
- Functions palette > Programming tab > Numeric

- Click on the function of the desired arithmetic operation
- Click on the back panel to place the arithmetic function at a specific location
- Functions palette > Programming tab > Numeric


- How to define Boolean constants (usually used to turn on/off LEDs):
- Functions palette > Programming tab > Boolean

- Click on the True Constant
 or False Constant
- Click on the back panel to place the Boolean constant at a specific location
- Functions palette > Programming tab > Boolean

- How to wire:
- Tools palette > Wiring tool

- Click the desired object output terminal (on the left side) to wire from
- Click the desired object input terminal (on the right side) to wire to
- Tools palette > Wiring tool
References
Introduction to LabVIEW, Six-Hour Course [Courseware]. (June 2003) Austin, TX: Worldwide Technical Support and Product Information, National Instruments Corporation.
“LabVIEW Block Diagram Explained.” National Instruments, National Instruments, 4 Feb. 2020, www.ni.com/en-us/support/documentation/supplemental/08/labview-block-diagram-explained.html.
“Case Structure.” National Instruments, National Instruments, 4 Feb. 2020, www.zone.ni.com/reference/en-XX/help/371361R-01/glang/case_structure/.
“LabVIEW Front Panel Explained.” National Instruments, National Instruments, 4 Feb. 2020, www.ni.com/en-us/support/documentation/supplemental/08/labview-front-panel-explained.html.
| ||||||||