Difference between revisions of "Sustainable Energy Vehicle Competition"
| Line 263: | Line 263: | ||
<center><math>Competition Equation = \frac{(Distance\left[\text{ft}\right])^2}{Time[\text{s}]} \times \frac{100}{Cost\left[$\right]}</math></center><p style="text-align:right">(8)</p> | <center><math>Competition Equation = \frac{(Distance\left[\text{ft}\right])^2}{Time[\text{s}]} \times \frac{100}{Cost\left[$\right]}</math></center><p style="text-align:right">(8)</p> | ||
Sample calculation of the Competition Equation: | |||
Data collected: | |||
Distance traveled = 30.00 ft | |||
Time taken for trial = 80.00 seconds | |||
Cost of vehicle = $13.30 | |||
<center><math>Competition Equation = \frac{(30.00\left[\text{ft}\right])^2}{80.00[\text{s}]} \times \frac{100}{13.30\left[$\right]}</math></center><p style="text-align:right"> | |||
=== 3. Sustainable Energy Vehicle Competition === | === 3. Sustainable Energy Vehicle Competition === | ||
Revision as of 07:13, 27 October 2024
Objective
The objective of this lab is to evaluate different sources of renewable energy and use the results of that evaluation to design a vehicle that is either directly powered by a renewable energy source or a capacitor that is charged by a renewable energy source. The design will be entered in a competition that is judged by an equation that uses the distance traveled, travel time, and cost.
Overview
From sails to power boats, windmills to pump water, or water-driven wheels to power machinery that mills grains, humans have been using renewable energy sources for millennia. Today, a significant amount of our energy production comes from non-renewable resources, such as oil, natural gas, and coal. The detrimental effects on public health and the environment from burning fossil fuels have prompted greater interest and investment in renewable energy sources, including solar, wind, and hydroelectric power though hydroelectric power is used considered in this lab. Scientists and engineers must address concerns about the inability of some renewable sources, notably solar power and wind power, to generate power consistently so there is equal interest in developing energy storage devices that can operate at grid-scale or hold sufficient energy to power entire communities for an extended time after being charged by a renewable energy source.
Types of Renewable Energy
Renewable energy is a type of energy that can be harnessed from naturally replenished resources. Some examples of renewable energy sources are sunlight, wind, and water. There are many benefits to using renewable energy. If these renewable resources can be harnessed effectively, they can solve the problems with using non-renewable energy sources (NextEra Energy Resources, 2012). In the last few years, renewable energy has been the fastest-growing energy source globally (International Energy Agency, 2021). In this lab, solar and wind energy will be used.
Solar Power
Sunlight, like any other type of electromagnetic radiation, contains energy. Typically, when sunlight hits an object, the energy that it contains is converted into heat. Certain materials can absorb and convert that energy into an electrical current. In this form, sunlight can be used as a power source or stored for later use.
Solar panels are semiconductor-based devices that generate electrical current directly from sunlight. Many high-efficiency solar panels that are commercially available are made from crystalline silicon..
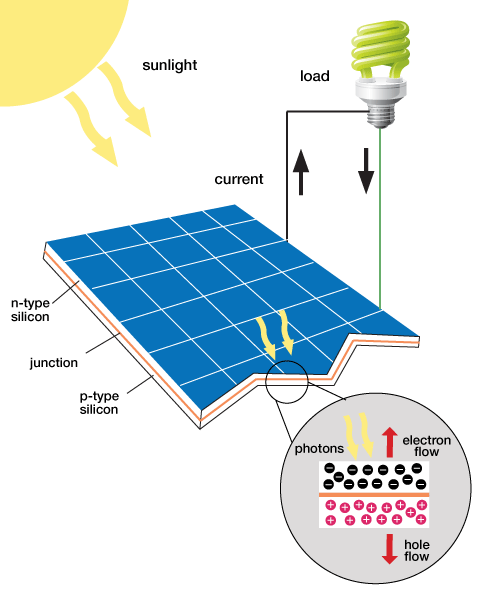
To produce a current, there must be a difference in the concentration of electrons between one area and another to cause their flow. In a silicon solar cell, a concentration difference is created using two types of silicon, p-type and n-type. The p-type silicon is created by adding a material that has one fewer electron in their valence energy level than silicon has. As a result, a vacancy of electrons, or a hole, forms. The n-type silicon is created by adding a material that has one more electron in their valence energy level than silicon has so that there is an excess of electrons that can move around the crystal structure and create an electrical current. In a solar cell, p-type and n-type silicon are sandwiched together to create a p-n junction, as shown in Figure 1 (Locke, 2008). The p-type area is positively charged, and the n-type area is negatively charged.
When sunlight hits the silicon on the solar panel, the photons from the sunlight energize the electrons in the material. The electrons within the crystal move to a higher energy level, creating holes. If the p-type and n-type silicon are connected with a wire, the electrons will flow from the n-type layer to the p-type layer, and electrical current is generated.
Wind Energy
Wind turbines are used to capture the wind’s energy and convert it into electrical energy. The blades on wind turbines are slanted so that as the wind passes over the blades, it creates an uneven pressure on each side, causing them to rotate. The spinning blades drive a low speed shaft connected to a gearbox. The gearbox converts the low speed rotation to a high speed rotation through a high speed shaft. The high speed shaft is connected to a brake and then into an electrical generator where mechanical energy is converted to electrical energy (Layton, 2011).
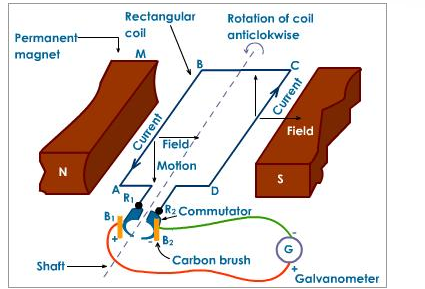
A basic electrical generator is made of permanent magnets on each side with a rectangular coil connected to a commutator, which is a rotary electrical switch (Figure 2). The two permanent magnets on each side create a magnetic field. As the rectangular coil spins mechanically, the magnetic field through the area of the coil changes, creating an alternating current through the coil. The commutator switches the polarity of the coil just as the polarity of the alternating current changes, creating a direct current. The current is then output from the wind turbine (Layton, 2011).
Energy Storage
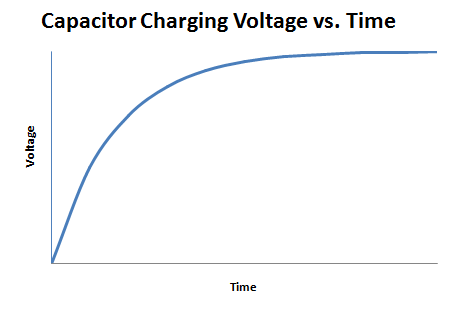
Capacitors have many uses in circuits and signal processing. A capacitor is an electrical device that is used to store charge temporarily. In this lab, a capacitor will be used as the power source for the renewable energy vehicle. A capacitor is charged by a voltage source logarithmically, as shown in Figure 3.
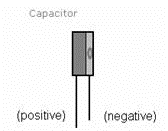
Because of their design, capacitors can be sensitive to the polarity of the voltage applied to them. The capacitors used in this lab must be connected with the proper polarity. In this lab, the capacitor’s negative lead must be connected to the negative applied voltage (Figure 4). Failure to do this will cause the capacitor to fail.
The energy a capacitor holds is proportional to the square of the voltage across the capacitor (1). In (1), E is the energy, C is the capacitance, and V is the voltage.
(1)
Electrical Components
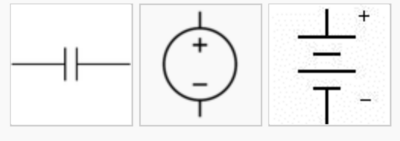
The design of a circuit determines its behavior. In this lab, one circuit design will increase the speed output of a motor and the other will increase the torque output of a motor. In electrical engineering, different electrical components are represented by different symbols. Figures 5 show the symbols for a capacitor, DC source, and battery. They are all forms of energy storage devices.
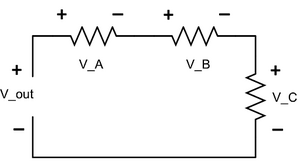
Different arrangements of electrical components allow engineers to design different circuits that can be arranged in two different ways. In a series circuit, the circuit's components are connected end to end (Figure 6). The current in a series circuit remains the same in all the electrical elements.
In a series circuit, the sum of the voltages across each element is equal to the voltage of the power source (2). Note that there is a single path for current to flow through. In (2), Vout is the voltage output and VA, VB, and VC represent the voltage of the individual components.
(2)
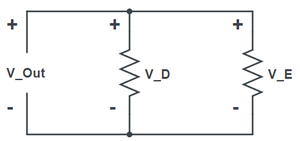
In a parallel circuit, as shown in Figure 7, the circuit's components are connected at opposing ends. The current that is supplied by the voltage source equals the current that flows through elements D and E.
The voltage across the elements that are parallel is the same (3). In comparison to a series circuit, a parallel circuit has multiple paths for the current to flow through. In (3), Vout is the voltage output and VD and VE represent the voltage of the individual components.
(3)
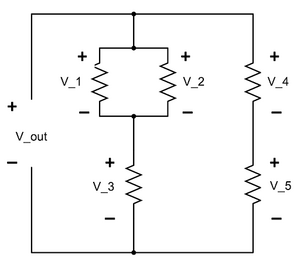
Most circuits contain both series and parallel components. The parallel components can be thought of as branches, and each branch contains its own series circuit. Figure 8 shows a circuit that contains both series and parallel components. There are two branches, one on the left and the right. The branch on the right contains only series connections, while the branch on the left contains both series and parallel connections.
Using knowledge of series and parallel circuits, the voltage Vout can be calculated. Since V4 and V5 are in series, the voltage Vout must be equal to V4 + V5 (4).
(4)
Additionally, V1 and V2 are in parallel, meaning that their voltages are the same. Knowing this, and that V3 is in series with the parallel circuit, Vout can be calculated in a different way (5).
(5)
A digital multimeter will be used in this lab to read the current and voltage across components in circuits. Please read the Digital Multimeters Guidelines before performing this lab to understand how to properly operate a digital multimeter. Digital multimeters can measure either voltage in volts or current in amps, indicated by the symbols shown in the circuit diagram (Figure 9).
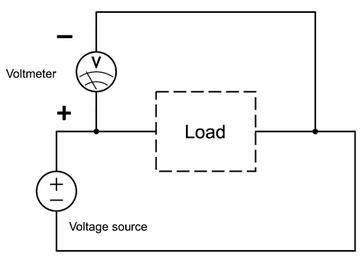
Depending on whether voltage or current is being measured in a circuit, the multimeter will be arranged in the circuit in a different manner. To measure the voltage across an electrical component, the multimeter must be placed in the circuit in parallel (Figure 10).
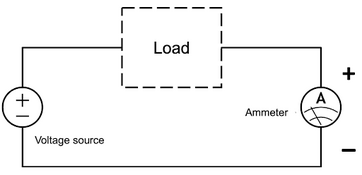
To measure the current across an electrical component, the multimeter must be placed in the circuit in series with the component (Figure 11). As described in the Digital Multimeters Guidelines, ensure the leads are connected to the correct multimeter ports depending on which value is being measured.
After measuring the voltage and current across a component in a circuit, the electrical power output of that component can be calculated using the Power Law (6). In (6), P is the power in Watts, I is the current in Amperes, and V is the voltage in Volts.
(6)
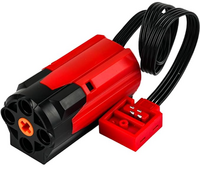
The motor provided in the lab is a 9.00 V DC motor that will operate with voltages no more than 9.00V with reduced torque and speed (Figure 12). A motor with no load operates under the current of 9.00 mA, and a stalled motor operates under the current of over 350.00 mA. Increasing the voltage provided to the motor increases the speed. Increasing the current, increases the torque.
To increase the torque or speed of a power source, gear ratios can be used. When connecting two gears with different tooth counts, the rotational speeds of the gears differ. The gear ratio is used to calculate the ratio of rotational speeds of different gears based on the number of teeth on each gear (7).
(7)
Teethout is the gear that is receiving rotational energy and Teethin is the gear that it is controlling. As the gear ratio increases, the output gear spins slower. A gear ratio of 2 means that the input gear must spin two times for the output gear to spin once, a ratio of 3 means the input gear must spin three times, and so on.
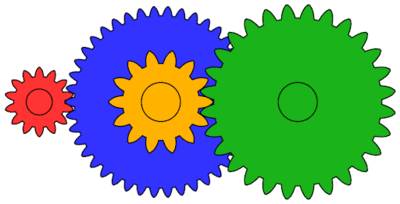
Figure 13 shows three gears with different ratios. Taking the red gear to be the input gear, there is a large gear ratio between the red gear and the blue gear it is driving. The blue gear spins much slower, and it transfers that rotation to the yellow gear. Again, there is a large gear ratio between the yellow and green gears, and so the green gear spins even slower.
Design Considerations
- Which renewable energy source yields the most voltage per unit cost?
- Which circuit configuration will provide the most voltage across the load? Parallel or series?
- Which aspects of the competition equation are most advantageous?
Materials and Equipment
Materials with Price List
| Material | Unit | Cost Per Unit ($) |
|---|---|---|
| Horizon Wind-Turbine | 1 | 7.50 |
| Solar Panel | 1 | 10.00 |
| 1 F 2.7 V Capacitor | 1 | 3.00 |
| Mini Breadboard and Wires | 1 | 0.00 |
| LEGO Kit (Limit One Per Design) | 1 | 0.00 |
| LEGO to Plug Connector | 1 | 0.10 |
| Tape | 1 foot | 0.10 |
Equipment Used
- Horizon wind-turbine
- Sunforce 50013 1.00 W solar battery charger
- Adjustable table fan
- Heat lamp
- 3.00 V power supply
- Digital multimeter
- Piezo buzzer
- 7.4 V DC motor
- A 1.00 F 2.70 V capacitor
- Mini Breadboard
- LEGO to Plug connector
- Standard LEGO kit
- Scissors
- Tape
Procedure
The power storage device and power sources will be tested individually. The results of the tests will be used in determining the best power source for the sustainable energy vehicle.
1. Testing the Power Storage Device
During this part of the procedure, a capacitor will be charged and discharged with a piezo buzzer. The current of the circuit with two capacitors, a piezo buzzer, and a multimeter in series and in parallel will be measured.
Charging a Capacitor
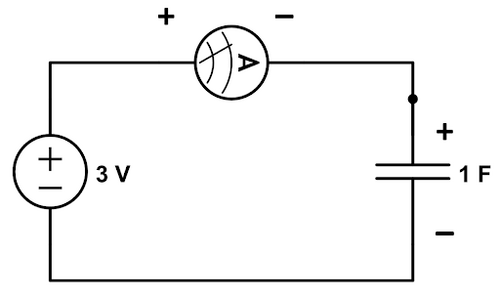
- The circuit in Figure 14 will be created to charge a capacitor. Place a capacitor in the breadboard and connect a wire from the negative end of the ammeter to the capacitor, and another wire from the capacitor to the negative end of the 3.00 V power supply. Red is positive and black is negative.
- Connect the positive side of the ammeter to the positive side of the 3.00V battery.
- Charge the capacitor until the current in the circuit is near 0.00 A.
- Discharge the charged capacitor by connecting it to the piezo buzzer. The capacitor is discharging when the piezo buzzer makes a noise.
Power Output of Capacitors in Series and Parallel
- Charge a capacitor until fully charged using the battery.
- Set the capacitor aside in a safe place. Be careful not to discharge it when moving.
- Get a new capacitor and fully charge it.
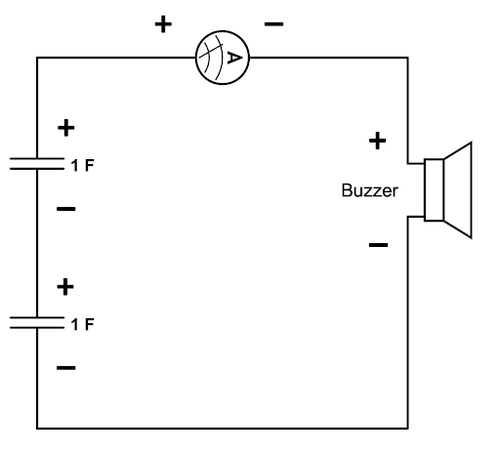
- Wire the two capacitors, the buzzer, and the multimeter in series. Only connect the capacitors long enough to record the measurement. Recharge the capacitors between measurements.
- Refer to the schematic in Figure 15.
- Remember to check for the proper polarity, otherwise the circuit will not run
- Record the current produced by the circuit in series.
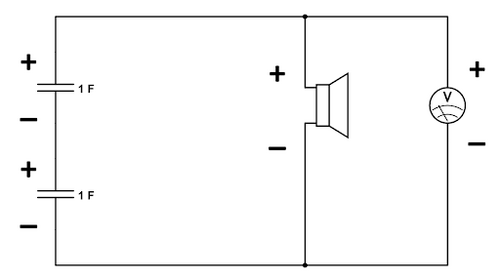
- Record the voltage across the piezo buzzer.
- Refer to the schematic in Figure 16.
- Remember to check for the proper polarity, otherwise the circuit will not run
- Repeat steps 1-3.
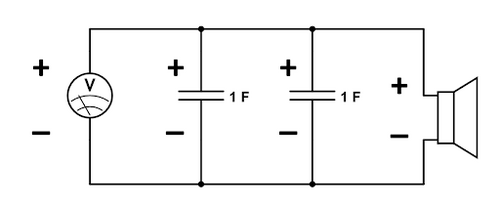
- Wire the two capacitors, the buzzer, and the multimeter in parallel.
- Refer to the schematic in Figure 17.
- Draw a schematic for a circuit that will measure the current through the piezo buzzer with capacitors in parallel. Get a TA’s approval for the schematic.
- Create the circuit and record the current through the buzzer.
- Calculate the power output for capacitors connected in series and capacitors connected in parallel.
2. Testing the Power Sources
One type of renewable power source will be assigned and analyzed. Using the digital multimeter, both voltage and current must be measured and recorded, and the power output must be calculated.
Wind Turbine
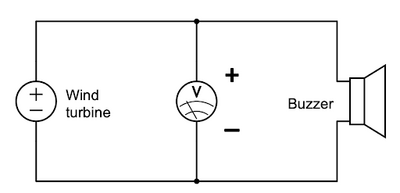
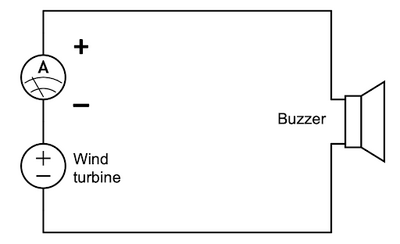
- Connect the wind turbine to the piezo buzzer using the breadboard and wires following the schematic presented earlier. Measure the voltage and current across the piezo buzzer using the digital multimeter.
- Adjust the position of the turbine blades near the fan to find the highest voltage and current that can be generated.
- Calculate and record the power generated by the turbine and give the information to a TA (Figures 18-19).
Solar Panel
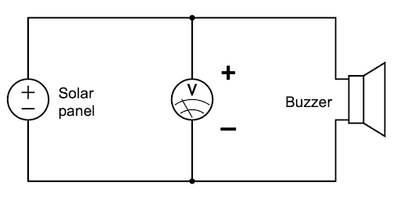
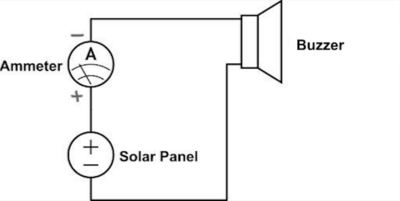
- Connect the solar panel to the piezo buzzer using the breadboard and wires. Place the solar panel near the heat lamp and measure the voltage and current across the music voltmeter using the digital multimeter.
- Calculate and record the power generated by the solar panel and give the information to a TA (Figure 20).
Data Analysis
- The TA will display the power data from each renewable energy source on the board. Based on the power output of each renewable energy source and the analysis of the circuits in series and parallel, determine the best power source and circuit design to power a sustainable energy vehicle with two capacitors.
Caution! The heat lamps and solar panels may become extremely hot when used for a long duration of time. Do not touch them immediately after use and turn them off when not in use.
Competition Rules
The competition rules must be followed at all times during the competition. Violation of any of these rules will result in the disqualification of the design.
- The renewable energy vehicle must carry its power storage device (e.g. capacitor)
- The capacitors may only be connected to the power source for one minute regardless of how they are connected.
- If two capacitors are connected and charged in series, they may only charge for one minute.
- If two capacitors are charged in parallel, they may only charge for one minute.
- Each design will only be allowed one trial.
- Do not touch the leads of the charged capacitors or allow the leads to touch each other, this will discharge the capacitor.
- Do not connect the power storage device until immediately before the trial is run.
- The trial will end once the vehicle stops moving or after a maximum of 5.00 min.
- The design with the highest competition equation result wins. In (8), distance is measured in feet, time in seconds, and cost in dollars.
(8)
Sample calculation of the Competition Equation:
Data collected:
Distance traveled = 30.00 ft
Time taken for trial = 80.00 seconds
Cost of vehicle = $13.30
3. Sustainable Energy Vehicle Competition
- Assess the materials provided and consider the data from testing the power storage device and testing the power sources. Keep in mind the variables of the competition equation while choosing materials for the vehicle design. Make preliminary sketches during this process.
- A minimum of two capacitors must be used in the design. The vehicle must carry its power storage device. While modifying the design, keep in mind the space needed to fit the power storage device (capacitor) and its wires. Prepare a cost list of the materials used in the design and specify the total price. A TA must approve the sketches and the cost list.
- Create a circuit diagram on paper showing the capacitors and motor. The diagram should reflect how the vehicle is wired, and should be used when constructing the vehicle. A TA must approve the circuit diagram.
- A TA will provide the materials needed for the design. If the design is modified during the construction, note the changes and explain the reasons for them. If the modifications require more materials to be used, update the cost list and have a TA approve it.
- With the chosen power source, charge the capacitors for 1.00 min.
- Construct the vehicle based on the sketched design.
- Before entering the competition, make sure the motors turn in the desired direction of travel.
- Run the trial.
- Give the cost of the design to a TA. The TA will provide the competition results.
Assignment
Team Lab Report
Follow the lab report guidelines laid out in the EG1004 Writing Style Guide. Respond to the questions and comments below in the appropriate sections in the report.
- Describe the rules, competition equation, and design strategy of the competition in the introduction. What consequences did the rules and competition equation have for any design decisions?
- Explain how solar panels and wind turbines work
- Discuss capacitors
- Discuss the advantages and disadvantages of the solar panel and wind turbine
- Describe the renewable energy vehicle design and explain the choices made in the design
- Discuss the power sources and their power output. How did the voltage measurements of the power sources impact the design?
- Discuss minimal design. Were all the materials purchased used? Describe the importance of minimal design and explain how it was employed in the design. Did the design minimize cost?
- Describe how the design succeeded or failed. What choices would improve the design’s standing in the competition?
- Discuss how the competition equation can be increased, and how the design compared to the other designs
- Specify the power source chosen for the design
- Include the spreadsheet with every design's results. Describe the results and talk about other designs in the competition
- Include a digital drawing of the motor circuit used in the sustainable vehicle design
Remember: Lab notes must be taken. Experimental details are easily forgotten unless written down. EG1004 Lab Notes paper can be downloaded and printed from the EG1004 Website. Use the lab notes to write the Procedure section of the lab report. At the end of each lab, a TA will scan the lab notes and upload them to the Lab Documents section of the EG1004 Website. One point of extra credit is awarded if the lab notes are attached at the end of the lab report. Keeping careful notes is an essential component of all scientific practice.
Team PowerPoint Presentation
Follow the presentation guidelines laid out in the EG1004 Lab Presentation Format in the Technical Presentations section of the manual. When preparing the presentation, consider the following points.
- Since one term in the competition equation is cost, present the cost of the vehicle. Use the page How to Show Cost Data in Presentations for instructions on how to do this
- How would the renewable energy vehicle be improved?
References
Layton, J.. "How Wind Power Works." How stuff works. Discovery, 2011. Retrieved 24 July 2012. <http://science.howstuffworks.com/environmental/green-science/wind-power.htm>.
Locke, S.. "How Does Solar Power Work." Scientific American. Scientific American, 2008. Retrieved 24 July 2012. <http://www.scientificamerican.com/article.cfm?id=how-does-solar-power-work>.
NextEra Energy Resources, LLC. "Benefits of Renewable Energy." NextEra Energy Resources. NextEra Energy Resources, 2012. Retrieved 24 July 2012. <http://www.nexteraenergyresources.com/content/environment/benefits.shtml>.
Reg Tyler, . "Types of Fuel Cells." Energy efficiency and renewable energy. U.S. Department of Energy, 2011. Retrieved 24 July 2012. <http://www1.eere.energy.gov/hydrogenandfuelcells/fuelcells/fc_types.html>.
| ||||||||







![{\displaystyle CompetitionEquation={\frac {(Distance\left[{\text{ft}}\right])^{2}}{Time[{\text{s}}]}}\times {\frac {100}{Cost\left[\$\right]}}}](https://wikimedia.org/api/rest_v1/media/math/render/png/d438dd0ada3fbd06c3aeb4d56fe63ae518b6e2a1)
![{\displaystyle CompetitionEquation={\frac {(30.00\left[{\text{ft}}\right])^{2}}{80.00[{\text{s}}]}}\times {\frac {100}{13.30\left[\$\right]}}}](https://wikimedia.org/api/rest_v1/media/math/render/png/4fa7c29e7dd66504fa98c2bed7b9ce1af0f87965)