Difference between revisions of "Sustainable Energy Applications (Virtual)"
(1003 --> 1004) |
|||
| (13 intermediate revisions by one other user not shown) | |||
| Line 99: | Line 99: | ||
In (4), P is the power in Watts, I is the current in Amperes, and V is the voltage in Volts. | In (4), P is the power in Watts, I is the current in Amperes, and V is the voltage in Volts. | ||
The <b>motor</b> provided in the lab is a 9V VEX motor that will operate with voltages lower than 9V with reduced torque and speed (Figure 10). A motor with no load draws 9 mA, and a stalled motor draws well over 350 mA. Increasing the voltage provided to the motor increases the speed. Increasing the current increases torque. | |||
[[Image:Vex_motors.png|thumb|200px|center|Figure 10: 9V VEX Motor]]-- | [[Image:Vex_motors.png|thumb|200px|center|Figure 10: 9V VEX Motor]] | ||
<!-- | |||
=== VEX Robotics === | === VEX Robotics === | ||
Vex Robotics is used globally for students to understand the fundamentals of robotics. It is commonly used to model the capabilities of vehicles. | Vex Robotics is used globally for students to understand the fundamentals of robotics. It is commonly used to model the capabilities of vehicles. | ||
| Line 108: | Line 109: | ||
[[Image:Vex_image.png|thumb|200px|center|Figure 10: 9V VEX Motor]] | [[Image:Vex_image.png|thumb|200px|center|Figure 10: 9V VEX Motor]] | ||
--> | |||
== Design Considerations == | == Design Considerations == | ||
| Line 132: | Line 134: | ||
|}--> | |}--> | ||
* | * TinkerCad | ||
= Procedure = | = Procedure = | ||
| Line 155: | Line 157: | ||
# Wire the negative end of the 9V battery to the negative end of the multimeter. To wire these two components, simply click on the negative terminal of the battery, and click once again on the negative terminal of the multimeter. <b><font color=#ff0000>Red</font></b> is the positive terminal and <b>black</b> is the negative terminal. | # Wire the negative end of the 9V battery to the negative end of the multimeter. To wire these two components, simply click on the negative terminal of the battery, and click once again on the negative terminal of the multimeter. <b><font color=#ff0000>Red</font></b> is the positive terminal and <b>black</b> is the negative terminal. | ||
# Similarly, wire the positive end of the multimeter to terminal 1 on the capacitor. Wire terminal 2 on the capacitor to the positive terminal of the battery. | # Similarly, wire the positive end of the multimeter to terminal 1 on the capacitor. Wire terminal 2 on the capacitor to the positive terminal of the battery. | ||
# Click the “A” on the multimeter to measure ampere. | |||
# To charge the capacitor click Start Simulation. Charge the capacitor until the current in the circuit is zero ampere (0A). | # To charge the capacitor click Start Simulation. Charge the capacitor until the current in the circuit is zero ampere (0A). | ||
# Click on Stop Simulation once the multimeter reading is zero ampere (0A). | # Click on Stop Simulation once the multimeter reading is zero ampere (0A). | ||
| Line 211: | Line 214: | ||
#Download the [[Media: Lab_10_-_Sustainable_Energy_Applications_Raw_Data.xlsx| Excel file]] containing the raw data for the yearly energy consumption of various renewable energy sources from 1949 to 2019 | #Download the [[Media: Lab_10_-_Sustainable_Energy_Applications_Raw_Data.xlsx| Excel file]] containing the raw data for the yearly energy consumption of various renewable energy sources from 1949 to 2019 | ||
#The line graph will contain multiple lines that | #The line graph will contain multiple lines that represent the different renewable energy sources. The procedure to graph the renewable energy consumption for hydroelectric power is provided. <b>Complete a similar procedure for the remaining renewable energy sources.</b> | ||
##On the Excel ribbon, click on the Insert tab, and click “Scatter with Straight Line” on the Scatter option under the Charts group. This should create a blank line graph, as shown in Figure | ##On the Excel ribbon, click on the Insert tab, and click “Scatter with Straight Line” on the Scatter option under the Charts group. This should create a blank line graph, as shown in Figure 12. | ||
##;[[Image:Lab10_excel_ribbion.png|500px|thumb|center|Figure | ##;[[Image:Lab10_excel_ribbion.png|500px|thumb|center|Figure 12: Inserting a Line Graph]] | ||
##Right-click on the empty graph and choose the “Select Data” option. A new window will appear where the graphed data can be inputted. | ##Right-click on the empty graph and choose the “Select Data” option. A new window will appear where the graphed data can be inputted. | ||
##Under the “Legends Entries (Series)” tab, click on the “Add” option, as shown in Figure | ##Under the “Legends Entries (Series)” tab, click on the “Add” option, as shown in Figure 13. A new window called “Edit Series” will appear. | ||
##;[[Image:Lab10_excel_dataSource.png|500px|thumb|center|Figure | ##;[[Image:Lab10_excel_dataSource.png|500px|thumb|center|Figure 13: Utilizing the “Select Data Source” Window ]] | ||
##In the “Series name” textbox, type in the name of the power source. In this case, type in Hydroelectric Power. | ##In the “Series name” textbox, type in the name of the power source. In this case, type in Hydroelectric Power. | ||
##In the “Series X values” textbox, highlight the years in column A from 1949 to 2019. | ##In the “Series X values” textbox, highlight the years in column A from 1949 to 2019. | ||
##In the “Series Y values” textbox, highlight the total energy consumption from hydroelectric power in column B that corresponds to 1949 to 2019. The “Edit Series” should appear similar to Figure | ##In the “Series Y values” textbox, highlight the total energy consumption from hydroelectric power in column B that corresponds to 1949 to 2019. The “Edit Series” should appear similar to Figure 14. | ||
##;[[Image:Lab10_excel_editSeries.png|500px|thumb|center|Figure | ##;[[Image:Lab10_excel_editSeries.png|500px|thumb|center|Figure 14: Utilizing the “Edit Series” Window ]] | ||
##Click “OK” to graph the Hydroelectric Power data. | ##Click “OK” to graph the Hydroelectric Power data. | ||
#Next the data for the remaining renewable energy sources must be added to the same graph. To add the data, repeat steps 2b-g for each renewable energy source. | #Next the data for the remaining renewable energy sources must be added to the same graph. To add the data, repeat steps 2b-g for each renewable energy source. | ||
| Line 228: | Line 231: | ||
#To visualize the distribution of the various renewable energy sources in recent years, a pie chart will be created based on the 2019 year. This part will continue with the raw data obtained from the previous part. | #To visualize the distribution of the various renewable energy sources in recent years, a pie chart will be created based on the 2019 year. This part will continue with the raw data obtained from the previous part. | ||
#On the Excel ribbon, click on the Insert tab, and click “2-D Pie” on the Pie Chart option under the Charts group. This should create a blank line graph, as shown in Figure | #On the Excel ribbon, click on the Insert tab, and click “2-D Pie” on the Pie Chart option under the Charts group. This should create a blank line graph, as shown in Figure 15. | ||
#;[[Image:Lab10_pieChart.png|500px|thumb|center|Figure | #;[[Image:Lab10_pieChart.png|500px|thumb|center|Figure 15: Inserting a Pie Chart]] | ||
#Right-click on the empty graph and choose the “Select Data” option. A new window will appear where the graphed data can be inputted. | #Right-click on the empty graph and choose the “Select Data” option. A new window will appear where the graphed data can be inputted. | ||
#Under the “Legends Entries (Series)” tab, click on the “Add” option. A new window called “Edit Series” will appear. | #Under the “Legends Entries (Series)” tab, click on the “Add” option. A new window called “Edit Series” will appear. | ||
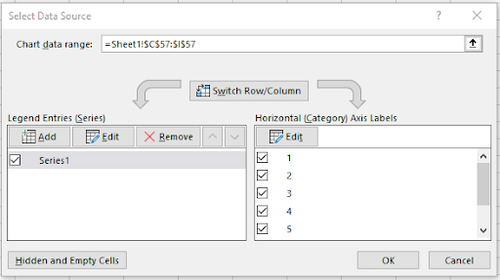
#In the “Series Values” textbox, highlight each renewable energy sources’ total energy consumption for the 2019 year. Completing this would automatically create five labels under the “Horizontal (Category) Axis Labels” tab, as shown in figure | #In the “Series Values” textbox, highlight each renewable energy sources’ total energy consumption for the 2019 year. Completing this would automatically create five labels under the “Horizontal (Category) Axis Labels” tab, as shown in figure 16. | ||
#;[[Image:Lab10_horizontalAxisLabels.png|500px|thumb|center|Figure | #;[[Image:Lab10_horizontalAxisLabels.png|500px|thumb|center|Figure 16: Horizontal Axis Labels]] | ||
#Select the row labeled “1” and click on the “Edit” option under “Horizontal (Category) Axis Labels” tab. In the “Axis-label range” textbox, | #Select the row labeled “1” and click on the “Edit” option under “Horizontal (Category) Axis Labels” tab. In the “Axis-label range” textbox, select the names of each renewable energy source (B2:F2) and select OK. | ||
#Rename the title appropriately. | #Rename the title appropriately. | ||
=== Fossil Fuel Energy Modeling === | === Fossil Fuel Energy Modeling === | ||
#Copy the data in the Fossil Fuel data sheet (located at the bottom | #Copy the data in the Fossil Fuel data sheet (located at the bottom left of the excel) to the main data sheet. Ensure that the data on the main sheet is not overwritten by the Fossil Fuel data. | ||
#Following the same steps as the “Modeling the Yearly Trend” procedure and “Modeling the 2019 Distribution,” create a new scatter plot and a new pie chart representing both renewable energy sources and fossil fuel energy sources. | #Following the same steps as the “Modeling the Yearly Trend” procedure and “Modeling the 2019 Distribution,” create a new scatter plot and a new pie chart representing both renewable energy sources and fossil fuel energy sources. | ||
##<b>For the renewable energy sources scatter plot you should have 5 series</b>: Hydroelectric, Geothermal, Solar, Wind, & Biomass. | ##<b>For the renewable energy sources scatter plot you should have 5 series</b>: Hydroelectric, Geothermal, Solar, Wind, & Biomass. | ||
| Line 249: | Line 252: | ||
*a scatter plot containing both renewable energy sources and fossil fuel energy sources | *a scatter plot containing both renewable energy sources and fossil fuel energy sources | ||
*a pie chart showing the 2019 distribution in renewable energy sources and fossil fuel energy sources | *a pie chart showing the 2019 distribution in renewable energy sources and fossil fuel energy sources | ||
=== Extra Credit === | === Extra Credit === | ||
To receive extra credit, predict the expected yearly energy consumption of wind power and solar power for 2030, 2040, and 2050 using Excel. Justify the methodology used to make this prediction.<b> To receive extra credit, this task must be completed with a reasonable justification before the end of the lab and also must be included in the team presentation.</b> | To receive extra credit, predict the expected yearly energy consumption of wind power and solar power for 2030, 2040, and 2050 using Excel. Justify the methodology used to make this prediction.<b> To receive extra credit, this task must be completed with a reasonable justification before the end of the lab and also must be included in the team presentation.</b> | ||
| Line 297: | Line 300: | ||
# Take screenshots of the designed vehicle and send it to the lab TA. | # Take screenshots of the designed vehicle and send it to the lab TA. | ||
The Lab TAs have prepared an Excel file with the section's competition results. It can be accessed in the [http://eg.poly.edu/documents.php Lab Documents] section of the | The Lab TAs have prepared an Excel file with the section's competition results. It can be accessed in the [http://eg.poly.edu/documents.php Lab Documents] section of the EG1004 website. This chart must be included in the PowerPoint presentation and in the Data/Observations section of the lab report. The lab work is now complete. Refer to the Assignment section for the instructions needed to prepare the lab report.--> | ||
= Assignment = | = Assignment = | ||
== Individual Lab Report == | == Individual Lab Report == | ||
<!--<b>Note:</b> You will be writing a team lab report rather than an individual one. See the [[Team Authoring Strategies]] page in the <i>Technical Communication</i> of this online manual for guidance of how to do this. | <!--<b>Note:</b> You will be writing a team lab report rather than an individual one. See the [[Team Authoring Strategies]] page in the <i>Technical Communication</i> of this online manual for guidance of how to do this. | ||
This lab report is <b>optional</b> and you will receive <b>extra credit</b> for submitting it. | This lab report is <b>optional</b> and you will receive <b>extra credit</b> for submitting it.--> | ||
{{Labs:Lab Report}} | |||
*Define renewable energy | |||
*Explain how solar panels and wind turbines work | |||
*Explain the concept of the capacitor | |||
*Discuss the advantages and disadvantages of both energy sources | |||
*Discuss the power sources and their power output. How did the voltage measurements of the power sources impact the power? | |||
*Specify the power source chosen for the design | |||
*Include the graphs for the renewable and nonrenewable energy trends | |||
*Based on the yearly trend for renewable energy consumption, discuss the qualitative changes in renewable energy in the past twenty years. Briefly research why these changes occurred | |||
*Based on both the yearly trend for renewable energy consumption and the 2019 distribution, what is the dominant source of renewable energy? Do you think it will remain the dominant source of renewable energy in the future? | |||
*Compare the yearly renewable energy trends with the fossil fuel energy trends. Discuss the modern energy consumption profile | |||
*Include screenshots of the batteries in parallel and batteries in series circuits. | |||
*Discuss what part of the lab you completed for your group and why it was important to the overall experiment. | |||
{{Labs:Lab Notes}} | {{Labs:Lab Notes}} | ||
| Line 324: | Line 328: | ||
{{Labs:Team Presentation}} | {{Labs:Team Presentation}} | ||
* Discuss why you chose your renewable energy source | *Discuss why you chose your renewable energy source | ||
* Discuss the power sources and their power output. How did the voltage measurements of the power sources impact the design? | *Discuss the power sources and their power output. How did the voltage measurements of the power sources impact the design? | ||
* Discuss | *Discuss why you chose to have the capacitors in series or parallel | ||
* | *Discuss your renewable energy consumption graphs and the trends observed | ||
*Discuss the overall energy consumption graphs and the trends observed | |||
= References = | = References = | ||
Latest revision as of 18:15, 22 August 2022
Objective
The experimental objective of this lab is to investigate and evaluate solar power and wind power as sources of renewable energy and use the results of that evaluation to theoretically power a sustainable energy vehicle. The second objective of this lab is to graphically compile and analyze the monthly energy consumption data from various renewable energy sources to understand the historical rising trend of renewable energy usage.
Overview
While humans have been using renewable energy sources, such as sails to power boats, windmills to pump water, or water-driven wheels to power machinery that mills grains, for millennia, the environmental impact of burning fossil fuels, such as oil, natural gas, and coal, has prompted greater interest in and greater investment in renewable energy sources, including solar power, wind power, and hydroelectric power. But some renewable energy sources cannot generate power consistently, notably solar power and wind power, so there is equal interest in developing energy storage devices that can operate at grid-scale or hold sufficient energy to power entire communities for an extended time after being charged by a renewable energy source.
Types of Renewable Energy
Renewable energy is a type of energy that can be harnessed from naturally replenished resources. Some examples of this are sunlight, wind, and water. There are many benefits of using renewable energy. They are clean energy sources, and they come from an abundant source that do not become depleted. If these renewable resources can be harnessed efficiently, they can solve the problems with using non-renewable energy sources, such as fossil fuels (NextEra Energy Resources, 2012).
Solar Power
Sunlight, like any other type of electromagnetic radiation, contains energy. Typically, when sunlight hits an object, the energy that it contains is converted into heat. Certain materials can convert the energy into an electrical current. In this form, it can be used as a power source and it can be stored as energy.
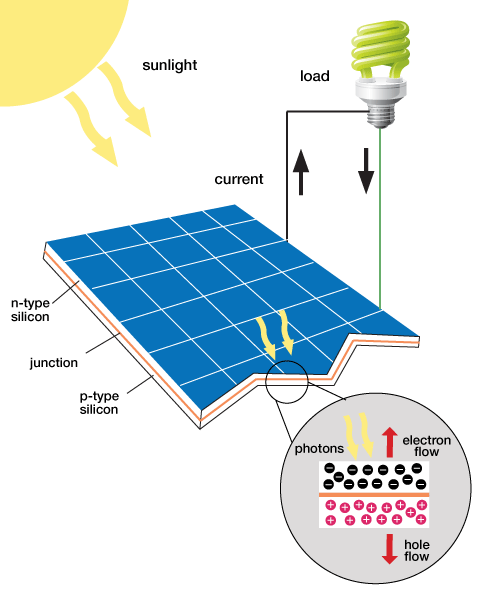
In a crystal structure, the materials used for solar panels contain covalent bonds where electrons are shared by the atoms within the crystal. When the light is absorbed, electrons within the crystal become excited and move to a higher energy level. When this occurs, the electron has more freedom of movement within the crystal. When the electrons move around the crystal structure an electrical current is generated. The reaction that occurs when sunlight hits a solar panel is shown in Figure 1 (Locke, 2008).
Older solar panels use large crystalline structures made from silicon. When sunlight hits the silicon on the solar panel, the photons from the sunlight energize the electrons in the material. These energized electrons create a higher electrical potential in the material that is measured as a voltage between that material and ground.
The material copper indium gallium (di)selenide (CIGS) is also used in the production of solar panels. Panels made from CIGS have a smaller crystalline structure and are less expensive than their silicon counterparts. CIGS panels are relatively flexible and can easily be shaped into flexible films. The use of CIGS to make solar panels is referred to as thin-film solar technology because of its flexible nature. CIGS panels are not as good at converting absorbed light into electrical current compared to silicon. But for mass production purposes, CIGS solar panels are the more cost effective approach to produce solar panels for frequent use (Locke, 2008).
Wind Energy
Wind turbines are used to capture the wind’s energy and convert it into electrical energy. The blades on wind turbines are slanted so that as the wind passes over the blades it creates an uneven pressure on each side, causing them to rotate. The spinning blades drive a low speed shaft connected to a gearbox. The gearbox within the wind turbine converts the low speed rotation to a high speed rotation through a high speed shaft. The high speed shaft is connected to a brake and then into an electrical generator where mechanical energy is converted to electrical energy (Layton, 2011).
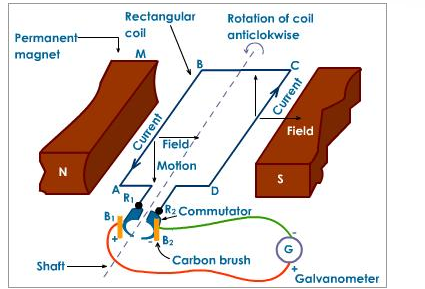
A basic electrical generator is made of permanent magnets on each side with a rectangular coil connected to a commutator, which is a rotary electrical switch (Figure 2). The two permanent magnets on each side create a magnetic field. As the rectangular coil spins mechanically, the magnetic field through the area of the coil changes, creating an alternating current through the coil. The commutator switches the polarity of the coil just as the polarity of the alternating current changes, creating a direct current. The current is then output from the wind turbine (Layton, 2011).
Energy Storage
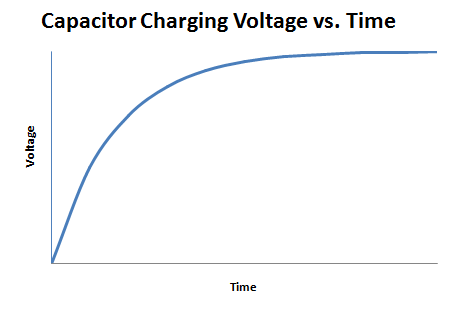
Capacitors have many uses in circuits and signal processing. In this lab, a capacitor can be used as the power source for the renewable energy vehicle. Fundamentally, a capacitor is an electrical device that is used to store charge temporarily. Some capacitors can be used in place of a battery, but they operate very differently from a battery. A capacitor is charged by a voltage source logarithmically, as shown in Figure 3.
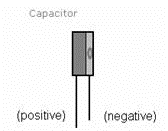
Because of their design, these capacitors are sensitive to the polarity of the voltage applied to them. The capacitors used in this lab must be connected with the proper polarity. In the lab, the capacitor’s negative lead must be connected to the negative applied voltage (Figure 4). Failure to do this will cause the capacitor to fail.
The energy a capacitor holds is proportional to the square of the voltage across the capacitor (1).
(1)
In (1), E is the energy, C is the capacitance, and V is the voltage.
Electrical Components
The design of a circuit determines its behavior. In this lab, one circuit design will increase the speed output of a motor and the other will increase the torque output of a motor. In electrical engineering, different electrical components are represented by different symbols. Figures 5A, 5B, and 5C show the symbols for a battery, capacitor, and DC source, respectively. They are all forms of energy storage devices.
Different arrangements of electrical components allow engineers to design different devices. Components, such as resistors, inductors, and capacitors, can be arranged in two different ways. In a series circuit, the element's components are connected end to end. The current in a series circuit remains the same in all the electrical elements. In a series circuit, as shown in Figure 6, the sum of the voltages across each element is equal to the voltage of the power source (2).
(2)
In (2), Vout is the voltage output and VA, VB, and VC represent the voltage of the individual components.
In a parallel circuit, as shown in Figure 7, the element's components are connected at opposing ends. The current that is supplied by the voltage source equals the current that flows though elements D and E. The voltage across the elements that are parallel is the same (3).
(3)
In (3), Vout is the voltage output and VD and VE represent the voltage of the individual components.
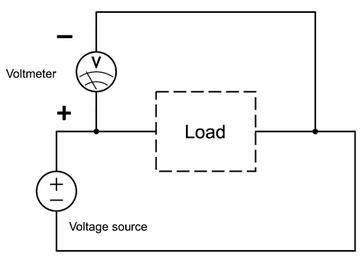
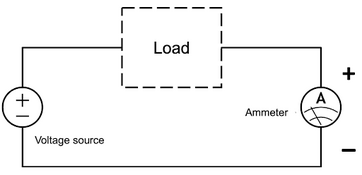
A digital multimeter will be used in this lab to read the current and voltage across components in circuits. Multimeters usually have two leads that directly touch two nodes in a circuit or the leads of an electrical component. Please read the Digital Multimeter Guidelines before performing this lab in order to understand how to properly operate a digital multimeter. Digital multimeters are indicated by different symbols in electrical circuits, depending on the value being measured by the multimeter. When measuring voltage, the multimeter is referred to as a voltmeter (Figure 8A). When measuring current, the multimeter is referred to as an ammeter (Figure 8B).
Depending on whether voltage or current is being measured in a circuit, the multimeter will be arranged in the circuit in a different manner. To measure the voltage across an electrical component, the multimeter must be placed in the circuit in parallel (Figure 9A). To measure the current across an electrical component, the multimeter must be placed in the circuit in series (Figure 9B).
After measuring the voltage and current across a component in a circuit, the electrical power output of that component can be calculated using the Power Law (4).
(4)
In (4), P is the power in Watts, I is the current in Amperes, and V is the voltage in Volts.
The motor provided in the lab is a 9V VEX motor that will operate with voltages lower than 9V with reduced torque and speed (Figure 10). A motor with no load draws 9 mA, and a stalled motor draws well over 350 mA. Increasing the voltage provided to the motor increases the speed. Increasing the current increases torque.
Design Considerations
- Which source yields the most voltage per unit cost?
- Which circuit configuration will provide the most desirable voltage across the load? Parallel or series?
Materials and Equipment
- TinkerCad
Procedure
This lab is divided into 3 sections: the testing of the power storage device, the investigation of renewable energy sources, and the data analysis of the United States’ renewable energy consumption. The power storage device and power sources will be tested individually. The results of the tests will be used in determining the best power source in designing the sustainable energy vehicle.
In order to create new circuits or copy an existing template of a circuit in Tinkercad, follow the steps below:
- Go to tinkercad.com and sign in with an Autodesk account.
- To start a new circuit, on the left side of the home screen select Circuit > Create new circuit.
- If a template link is provided in the procedure:
- Open the Tinkercad link for the part of the lab you want to work on. The links are provided in the procedure below.
- Select the Copy & Tinker option. This will copy the template to the workspace so it can be edited.
1. Testing the Power Storage Device
Charging a Capacitor
- Open a new Tinkercad circuit. Refer to the Starting the New Tinkercad Circuit procedure to open a new Tinkercad circuit.
- The circuit to charge a capacitor will be made in this part of the lab. The circuit is shown in Figure 11.
- Click and drag a 9V battery, 1 Farad capacitor, and multimeter on the interface as shown in Figure 11
- Wire the negative end of the 9V battery to the negative end of the multimeter. To wire these two components, simply click on the negative terminal of the battery, and click once again on the negative terminal of the multimeter. Red is the positive terminal and black is the negative terminal.
- Similarly, wire the positive end of the multimeter to terminal 1 on the capacitor. Wire terminal 2 on the capacitor to the positive terminal of the battery.
- Click the “A” on the multimeter to measure ampere.
- To charge the capacitor click Start Simulation. Charge the capacitor until the current in the circuit is zero ampere (0A).
- Click on Stop Simulation once the multimeter reading is zero ampere (0A).
- Take a screenshot of your circuit.
2. Testing the Power Sources
The physical wiring, voltage data, and current data for the wind turbine and the solar panel is given. Calculate the power for each power source.
| Power Source | Solar Panel | Wind Turbine |
|---|---|---|
| 5.89 | 4.24 | |
| 0.0061 | 0.0093 |
Batteries are not the same as capacitors. Batteries are used instead of capacitors because TinkerCAD does not allow for the capacitors to be charged at the beginning of a simulation.
Single Battery in Series with Multimeter
- Click and drag one 3V battery, a DC motor, and a multimeter on the interface.
- Wire the one 3V battery, the DC motor, and the multimeter in series.
- Refer to Figure 6 for how to wire a series circuit.
- Click on Start Simulation and record the final current produced by the circuit in series.
- Take a screenshot of the circuit with the current reading.
Batteries in Series
- Click and drag two 3V batteries, a DC motor, and a multimeter on the interface.
- Wire the two 3V batteries, the DC motor, and the multimeter in series.
- Click on Start Simulation and record the final current produced by the circuit in series.
- Repeat steps 1-3 but with a reversed polarity for one of the batteries. To do this, flip one of the batteries so that it is wired backwards.
- Take a screenshot of both circuits with the current reading.
Batteries in Parallel
- Click and drag two 3V batteries, a DC motor, and a multimeter on the interface.
- Wire DC motor and multimeter in series and the two 3V batteries in parallel.
- Refer to Figure 6 for how to wire a series circuit
- Click on Start Simulation and record the final current produced by the circuit in parallel.
- Repeat steps 1-3 but with a reversed polarity for one of the batteries. To do this, flip one of the batteries so that it is wired backwards.
- Take a screenshot of both circuits with the current reading.
Data Analysis
- Share and explain the circuits built and the data collected for the wind turbine, solar panel, batteries in parallel, and batteries in series to your group.
- Based on the calculated power of each renewable energy source and the results of the analysis of the circuits in series and parallel, determine the best power source and circuit design in order to theoretically power a sustainable energy vehicle with two capacitors.
- Sketch the circuit design in your notes and include the polarity on the capacitors and power sources.
3. Case Study: Historical Energy Statistics
In this part, a thorough investigation on the historical trends of renewable energy consumption in the United States will be conducted based on statistical data from the U.S. Energy Information Administration (EIA). In accordance with the data, four graphs will be constructed: a line graph showing the yearly trend for hydroelectric power, geothermal power, solar power, wind power, and biomass power, and a pie chart representing the 2019 distribution in renewable energy. These graphs will then be appended with data regarding fossil fuel energy consumption.
Modeling the Yearly Trend
- Download the Excel file containing the raw data for the yearly energy consumption of various renewable energy sources from 1949 to 2019
- The line graph will contain multiple lines that represent the different renewable energy sources. The procedure to graph the renewable energy consumption for hydroelectric power is provided. Complete a similar procedure for the remaining renewable energy sources.
- On the Excel ribbon, click on the Insert tab, and click “Scatter with Straight Line” on the Scatter option under the Charts group. This should create a blank line graph, as shown in Figure 12.
- Right-click on the empty graph and choose the “Select Data” option. A new window will appear where the graphed data can be inputted.
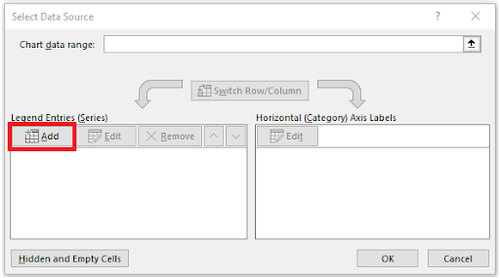
- Under the “Legends Entries (Series)” tab, click on the “Add” option, as shown in Figure 13. A new window called “Edit Series” will appear.
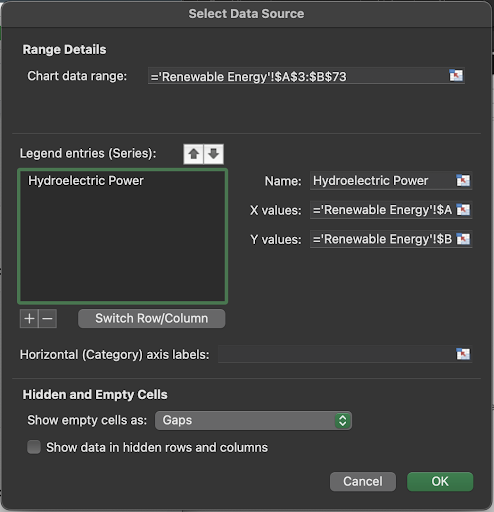
- In the “Series name” textbox, type in the name of the power source. In this case, type in Hydroelectric Power.
- In the “Series X values” textbox, highlight the years in column A from 1949 to 2019.
- In the “Series Y values” textbox, highlight the total energy consumption from hydroelectric power in column B that corresponds to 1949 to 2019. The “Edit Series” should appear similar to Figure 14.
- Click “OK” to graph the Hydroelectric Power data.
- On the Excel ribbon, click on the Insert tab, and click “Scatter with Straight Line” on the Scatter option under the Charts group. This should create a blank line graph, as shown in Figure 12.
- Next the data for the remaining renewable energy sources must be added to the same graph. To add the data, repeat steps 2b-g for each renewable energy source.
- Rename the axis and titles appropriately. Include a legend by checking off “Legend” in the dropdown menu at the top right of the graph.
Modeling the 2019 Distribution
- To visualize the distribution of the various renewable energy sources in recent years, a pie chart will be created based on the 2019 year. This part will continue with the raw data obtained from the previous part.
- On the Excel ribbon, click on the Insert tab, and click “2-D Pie” on the Pie Chart option under the Charts group. This should create a blank line graph, as shown in Figure 15.
- Right-click on the empty graph and choose the “Select Data” option. A new window will appear where the graphed data can be inputted.
- Under the “Legends Entries (Series)” tab, click on the “Add” option. A new window called “Edit Series” will appear.
- In the “Series Values” textbox, highlight each renewable energy sources’ total energy consumption for the 2019 year. Completing this would automatically create five labels under the “Horizontal (Category) Axis Labels” tab, as shown in figure 16.
- Select the row labeled “1” and click on the “Edit” option under “Horizontal (Category) Axis Labels” tab. In the “Axis-label range” textbox, select the names of each renewable energy source (B2:F2) and select OK.
- Rename the title appropriately.
Fossil Fuel Energy Modeling
- Copy the data in the Fossil Fuel data sheet (located at the bottom left of the excel) to the main data sheet. Ensure that the data on the main sheet is not overwritten by the Fossil Fuel data.
- Following the same steps as the “Modeling the Yearly Trend” procedure and “Modeling the 2019 Distribution,” create a new scatter plot and a new pie chart representing both renewable energy sources and fossil fuel energy sources.
- For the renewable energy sources scatter plot you should have 5 series: Hydroelectric, Geothermal, Solar, Wind, & Biomass.
- For the fossil fuel energy sources you should have 3 series: Coal, Natural Gas, & Petroleum.
- You should have a total of 8 series.
At the end of this case study there should be four graphs in total:
- a scatter plot containing the renewable energy sources
- a pie chart showing the 2019 distribution in renewable energy
- a scatter plot containing both renewable energy sources and fossil fuel energy sources
- a pie chart showing the 2019 distribution in renewable energy sources and fossil fuel energy sources
Extra Credit
To receive extra credit, predict the expected yearly energy consumption of wind power and solar power for 2030, 2040, and 2050 using Excel. Justify the methodology used to make this prediction. To receive extra credit, this task must be completed with a reasonable justification before the end of the lab and also must be included in the team presentation.
Assignment
Individual Lab Report
Follow the lab report guidelines laid out in the EG1004 Writing Style Guide in the Technical Writing section of the manual. Use the outline below to write this report.
- Define renewable energy
- Explain how solar panels and wind turbines work
- Explain the concept of the capacitor
- Discuss the advantages and disadvantages of both energy sources
- Discuss the power sources and their power output. How did the voltage measurements of the power sources impact the power?
- Specify the power source chosen for the design
- Include the graphs for the renewable and nonrenewable energy trends
- Based on the yearly trend for renewable energy consumption, discuss the qualitative changes in renewable energy in the past twenty years. Briefly research why these changes occurred
- Based on both the yearly trend for renewable energy consumption and the 2019 distribution, what is the dominant source of renewable energy? Do you think it will remain the dominant source of renewable energy in the future?
- Compare the yearly renewable energy trends with the fossil fuel energy trends. Discuss the modern energy consumption profile
- Include screenshots of the batteries in parallel and batteries in series circuits.
- Discuss what part of the lab you completed for your group and why it was important to the overall experiment.
Remember: Lab notes must be taken. Experimental details are easily forgotten unless written down. EG1004 Lab Notes paper can be downloaded and printed from the EG1004 Website. Use the lab notes to write the Procedure section of the lab report. At the end of each lab, a TA will scan the lab notes and upload them to the Lab Documents section of the EG1004 Website. One point of extra credit is awarded if the lab notes are attached at the end of the lab report. Keeping careful notes is an essential component of all scientific practice.
Team PowerPoint Presentation
Follow the presentation guidelines laid out in the EG1004 Lab Presentation Format in the Technical Presentations section of the manual. When preparing the presentation, consider the following points.
- Discuss why you chose your renewable energy source
- Discuss the power sources and their power output. How did the voltage measurements of the power sources impact the design?
- Discuss why you chose to have the capacitors in series or parallel
- Discuss your renewable energy consumption graphs and the trends observed
- Discuss the overall energy consumption graphs and the trends observed
References
Layton, J.. "How Wind Power Works." How stuff works. Discovery, 2011. Retrieved 24 July 2012. <http://science.howstuffworks.com/environmental/green-science/wind-power.htm>.
Locke, S.. "How Does Solar Power Work." Scientific American. Scientific American, 2008. Retrieved 24 July 2012. <http://www.scientificamerican.com/article.cfm?id=how-does-solar-power-work>.
NextEra Energy Resources, LLC. "Benefits of Renewable Energy." NextEra Energy Resources. NextEra Energy Resources, 2012. Retrieved 24 July 2012. <http://www.nexteraenergyresources.com/content/environment/benefits.shtml>.
Perlman, Howard.. "Hydroelectric Power: How it Works." U.S. Geological Survey, 2016. Retrieved 4 Jan 2018. <https://water.usgs.gov/edu/hyhowworks.html>.
Reg Tyler, . "Types of Fuel Cells." Energy efficiency and renewable energy. U.S. Department of Energy, 2011. Retrieved 24 July 2012. <http://www1.eere.energy.gov/hydrogenandfuelcells/fuelcells/fc_types.html>.
| ||||||||
