Difference between revisions of "Mars Rover Robot (MRR)"
m (moved Sandbox/MRR to Mars Rover Robot (MRR)) |
|||
| Line 1: | Line 1: | ||
= Introduction and Overview = | = Introduction and Overview = | ||
In 2013, there was a two-week government shutdown that closed down the National Aeronautics and Space Administration (NASA). Fortunately, they were able to come back online after the two-week period, but the incident caused major setbacks in all projects, including the Mars Rover. | In 2013, there was a two-week government shutdown that closed down the National Aeronautics and Space Administration (NASA). Fortunately, they were able to come back online after the two-week period, but the incident caused major setbacks in all projects, including the Mars Rover. | ||
Revision as of 22:46, 8 September 2014
Introduction and Overview
In 2013, there was a two-week government shutdown that closed down the National Aeronautics and Space Administration (NASA). Fortunately, they were able to come back online after the two-week period, but the incident caused major setbacks in all projects, including the Mars Rover.
Because of the setback, NASA is asking outside companies to help with the project. They have issued a request for the development of a cost-effective autonomous robot that can travel the surface of Mars and take water source readings. The robot should be able to get an accurate salinity reading of any water source, travel across uneven terrain, and return to the landing site.
The mission has two parts that must be completed. The first part uses a salinity sensor to measure the salt content of two water sources on the surface of Mars using an autonomous robot (see Course Specifications for more details). The second part of this mission involves analyzing several different water source samples found on Earth and making a graph of the density vs the salinity of the solutions (see Data Specifications for more details). Once the graph is complete, it will be used to analyze the water source readings taken by the robot on the course. Based on this analysis, a conclusion must be reached about whether or not life can exist on Mars.
Course Specifications
Design a robot using MLCad as your primary design tool. A model of your design must be built using the materials provided. A Mindstorms program that will direct the robot's movements must be created. A cost estimate of the robot's components must be provided. All revisions to the original design must be recorded and explained. This includes technical design drawings and cost estimates. All revisions to the Mindstorms program must be recorded and explained.
The Mars Recovery Robot (MRR) must be able to move autonomously over the surface of Mars and collect salinity readings from at least two of the three water sources that are located throughout the course. Between readings, the robot must return the first reading to the space shuttle and clean the sensor by dipping it into the distilled water beaker. For extra credit, the third water source reading can be taken. The robot must fit in a start area that is 25cm long by 25cm wide. There is no height restriction. The part of the robot containing the Vernier sensor must also fit within the size specifications. These specifications must be met for final commissioning.
Projectile (catapult, slingshot) designs are not allowed.
The robot program may not be altered or switched during any part of the mission. The robot must be fully autonomous and cannot be touched by any person during testing. Please refer to the course syllabus for all due dates.
The robot must return to the space shuttle to successfully complete the project.
'Note: Any student who attempts to alter the course in any way, shape, or fashion must meet with the Course Director to explain your attempt at academic dishonesty.
Main Tasks
The first part of the mission requires the robot to:
- Collect two different readings of water sources with the Vernier salinity sensor (Remember to return to the landing site between each reading)
- Return to the space shuttle at the landing site once both readings are taken
Extra Credit
Extra credit will be awarded if:
- The third water source reading is taken and returned to the space shuttle
- The robot travels down into and over the crater
Features
Project Schedule
A project schedule must be created in Google Sheets. Please refer to the template provided in your team Google Drive folder and our guide.
This schedule must include all tasks related to the project from the start of the project to Early or Final submission. The project schedule should include:
- Minimum of 20 tasks, excluding Milestones
- Milestones should be clearly indicated on the project plan (duration of zero days)
- Each task must include the person responsible for completing the task (resource names)
- Gantt chart must be displayed alongside the tasks list (fit onto one slide)
- Gantt chart must show a progress line
- Clearly state during the presentations whether the project is on-time, behind schedule, or ahead of schedule
- In milestone presentations, please present a “Project Status” slide, which should summarize key deadlines. You are not required to show your project schedule in these presentations
Drawings
All drawings and sketches should be made using LEGO Digital Designer (LDD). LDD can be installed for free from the LEGO website.
Using LDD, create four drawings of the robot: front, top, most detailed side, and a drawing of the gear train(s). Sensors, motors, and gears must be included in each drawing. If the robot does not use any gears, make sure to explicitly state that in your presentations.
Each revision of the design must be documented and all changes must be presented during Milestone presentations.
Model
The following materials will be provided:
- Mindstorms kit
- One NXT/EV3
- Sensors
- Motors
- Salinity sensor*
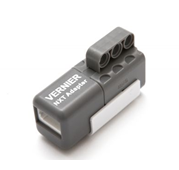
- NXT Sensor Adapter
* Please note that the salinity sensor will only be available for use in the Model Shop. This is for safety purposes as we do not want the sensor to be misplaced or damaged in transit from school to home.
The finished MRR must not exceed a footprint of 25cm × 25cm. There is no height limitation. The part of the robot containing the Vernier Sensor must also fit inside the same footprint.
Additional materials can be supplied by a TA.
Cost Estimate
Once a robot design is complete, a cost estimate must be generated that specifies the cost of all the materials and labor required for the construction of the design. Tabulate this cost information clearly in an Excel spreadsheet, using the materials cost list provided. Help in calculating the cost is available by reviewing how to plan the schedule and calculate costs for a project. The costs for the parts can be found on the price list for LEGO parts for robot projects.
Note: You should only use the materials contained in the price list for LEGO parts for robot projects. If you want to use other parts, get permission from your faculty member to do so, and also to determine the cost of the parts you want to use that are not in this price list.
The cost estimate should include the following:
- Labor cost breakdown with hours and rates
- Consolidate low-cost pieces: axles, beams, bricks, bushings, connectors, gears, plates
- Itemize high-cost pieces: controllers (EV3 brick), sensors, motors
- No decimal places; this is an estimate after all. Round appropriately
- Total cost must be shown in the bottom right corner
Notebook/Project Journal
While working on your project, you are expected to keep a record of all work done, as well as future plans and goals. In order to complete a Benchmark assessment, you must submit your notebook in .pdf format to the EG1004 website, as well as show your notebook to the Open Lab TA completing your assessment. A guide to writing the notebook, as well as a basic overview of its expectations, can be found here.
Data Specifications
Main Tasks
The second part of the mission is to:
- Create a graph measuring salinity (ppt) vs density. This is done by analyzing several different beakers filled with different 100 mL saline solutions with varying measures of salinity.
- Answer questions using the graph and readings from the water sources on the course
Background Information
For the first part of this project, a robot must collect the readings of at least two out of the three water sources located on the Mars Rover course using a salinity sensor. These readings alone provide limited data about the water source; more will be learned when the readings are analyzed and compared to other sources. By comparing the salinity reading of the water sources on the Mars course to known readings on Earth, it can be determined if life is possible on Mars.
Salinity
Salinity is the amount of salt dissolved in a body of water. This can be seen in bodies of water throughout the world. Most of the oceans have salinity between 34 and 36 parts per thousand (ppt) while the Mediterranean Sea has a salinity of 38 ppt. One of the more salty bodies of water in the world is the Dead Sea which has a salinity of 342 ppt, which is 9.6 times higher than that of the oceans.
The salinity sensor used in this project works by measuring the conductivity of the solution. The salt water can be measured in this way because there are ions in the water that can conduct electricity. In order to understand why this works, the basic chemistry of ionic and molecular compounds must be understood.
Salt is an ionic compound, which means that it is made up of two components, a metal and a non-metal. Some examples of salts are sodium chloride (NaCl), which is table salt, magnesium sulfate (MgSO4), potassium nitrate (KNO3), and sodium bicarbonate (NaHCO3). A molecular compound is made up of two components as well, but instead of it being a metal and a non-metal element like ionic compounds, it is two non-metals. A few examples of molecular compounds are carbon dioxide (CO2), water (H2O), and ethane (C2H6).
Ionic compounds are different from molecular compounds because molecular compounds are held together by bonds and ionic compounds are not. Non-metals have a tendency to gain electrons and have a little tendency to lose them. When two non-metals come together to make a molecular compound, they share electrons. This is because both non-metals want the other's electron(s) and do not want to give up their own; they form a bond to share those electron(s) between them. For ionic compounds, the metals have a tendency to lose electrons and the non-metals have a tendency to gain electrons, which sets up a perfect match. When the two are put near each other, the metal gives the non-metal an electron(s).
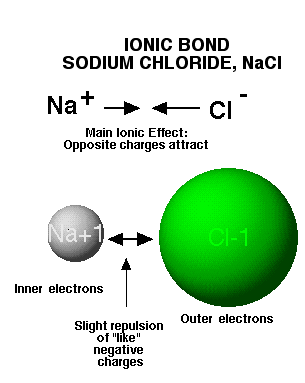
These newer elements are called ions and they can either be positive or negative. The metal ion tends to be positive because it gave an electron away (electrons are negatively charged), and the non-metal tends to be negative because it accepted an electron from the metal. These ions are what conducts electricity and the more ions there are, the more electricity they can conduct. This conductive property of ions is what allows the salinity sensor to determine the salinity of a solution, based on the number of salt ions in the water. Figure 10 shows the dissociation or separation of the two elements in table salt, sodium (Na) and chlorine (Cl). Notice that the metal (Na) becomes a positively charged ion while the non-metal (Cl) becomes a negatively charged ion based on the electron exchange.
Why It's Important
Salinity plays an important role is determining the chemistry of organisms that live in the oceans and seas that cover the Earth because it governs physical characteristics such as density and heat capacity. These physical characteristics also determine which organisms and plants can survive in a body of salt water. As described earlier, the Dead Sea has a very high salinity, causing the density to increase and creating a harsh environment that few life forms can survive in.
Although many organisms cannot survive in extremely high salinity bodies of water, such as the Dead Sea, some of them can still survive in lower salinity oceans and seas. Plants that can live in these very saline conditions are called extremophiles or halophiles, while those plants and organisms that can live in a wide range of salinities are called euryhalines. These species of plants have adapted to these harsher environments that are created by effects of salinity because even the slightest change in salt content can drastically change the temperature, density, or pressure of the body of water.
When describing the habitable properties for both freshwater and saltwater fish, many experts use the term specific gravity. Specific gravity is a ratio that can be determined by dividing the density of a substance by the density of a reference substance. Salt water is being used for this project so the reference density is the density of fresh water, which will be altered from the real value for the purposes of this project. The formula for specific gravity can be seen below where ρ (rho) is the density of a substance and ρreference is the density of the reference substance.
Failed to parse (MathML with SVG or PNG fallback (recommended for modern browsers and accessibility tools): Invalid response ("Math extension cannot connect to Restbase.") from server "https://wikimedia.org/api/rest_v1/":): {\displaystyle Specific Gravity = \frac{\rho}{\rho_{reference}}\!\,}
Specific gravity ratios are used for many purposes in chemistry, but for this project it plays an important role in determining whether fish can survive in certain salinities. Freshwater fish can survive in bodies of water with a specific gravity ranging from 0.00 – 0.02 and saltwater fish can survive in water with a specific gravity ranging from 0.02 – 0.07. Plants and organisms that can live in a wide range of salinities can survive with specific gravities ranging from 0.05 – 0.10 and those that can survive in extremely saline conditions can live in waters with specific gravities ranging from 0.11 – 0.14. These conditions are specific to this project only and do not replicate the real ratios.
Typically, chemists use the density of a solution to estimate its salinity, but for this project the opposite approach will be used. Using the salinity reading from the water sources on the Mars course, the density of these sources can be estimated. The procedure for obtaining data, making a graph, and analyzing the data are all explained below. Once the density of the Mars water sources are determined, they can be used to answer a series of questions concerning whether life is sustainable on Mars.
Obtaining and Graphing Data
For the second part of this project, a graph based on several known salt water samples will be created. This graph will be used to answer the question of whether life is habitable on Mars. This part requires the use of a robot and either the NXT or EV3 program. The robot may be touched for this part only. It will also have to be done during an Open Lab session and a TA will supply the following materials: several 100 mL beakers filled with salt water, a scale, and a salinity sensor.
Each one of the beakers is labeled and contains 100 mL of salt water solution ranging in salinities from 0 – 50 parts per thousand (ppt). Determine the density and the salinity of each solution using only a gram scale and a salinity sensor. Density can be recorded in grams per milliliter (g/mL) and salinity should be recorded in ppt. The formula for density is shown below for reference where m represents the mass and V represents the volume.
Failed to parse (MathML with SVG or PNG fallback (recommended for modern browsers and accessibility tools): Invalid response ("Math extension cannot connect to Restbase.") from server "https://wikimedia.org/api/rest_v1/":): {\displaystyle Density(\rho) = \frac{m}{V}\!\,}
All of the information recorded in this part of the section should be in an Excel spreadsheet. The beaker number should also be recorded along with all of the other information. Once the Excel spreadsheet is complete with all the different readings and measurements required to calculate density and salinity, make a graph on Microsoft Excel. The graph should be relatively linear and look similar to the one shown in Figure 11. Please remember to put a title, label both axes with units, and include a legend.
Analysis
Once the graph is complete, determine the density of the water source samples that were recorded on the Mars course in part one of this project. The density of these water sources taken from the Mars course will be used to answer the following questions:
- Which, if any, of the Mars water sources are habitable for freshwater fish?
- Which, if any, of the Mars water sources are habitable for saltwater fish?
- Would euryhalines survive? How about halophiles?
- Based on the answers to the other three questions, write four to five sentences answering the question "Could life exist on Mars?"
These questions along with their answers should be typed up neatly in a Microsoft Word document, showing all the formulas and calculations used to answer the questions as well as a few sentences explaining the calculations and the thought process. A simple formula and calculation will not suffice. Please note that these questions do require some critical thinking.
* Please remember to save all documents from part two (Excel sheet, graph, questions and answers) because they are required to commission and should all be included in the final submission folder.
Milestones, Benchmarks, and Deliverables
As work is done on the project, three Milestone presentations will report on the project's progress. All of the items assigned in each phase of the project are called Benchmark deliverables. These deliverables often consist of a combination of written submissions, presentations, and demonstrations. Benchmark assessments evaluate the progress of the project.
Preliminary Design Investigation
The Preliminary Design Investigation (PDI) is extremely important, as it lays the groundwork for the project. It outlines the project idea, inspiration, and goals.
The PDI must include:
- Cover Page
- Project Overview
- Goals & Objectives
- Design & Approach
- Cost Estimate
- Project Schedule
- Relevant Pictures
An example PDI template can be found here. The PDI is due by Benchmark A. Do not forget to include the items listed above. Use this link to access the VEX PDI Rubric.
Milestone 1
See How To Give a Milestone Presentation for the format of a Milestone presentation.
Milestone 1 is a presentation of the PDI. It is important that it outlines the project goals and show that the project is realizable.
The Milestone 1 presentation must include:
- Company profile
- Company name
- Product name
- Company officer title(s)
- Mission statement
- Project objective
- What is the project about?
- What tasks is the company aiming to accomplish? (Benchmark A requirements)
- Overall design approach to complete objective
- Background information
- Why is the project happening?
- What does the audience need to know?
- Technical design description
- Preliminary conceptual drawing of robot design
- Rendered and digital sketches are acceptable, CAD not required
- What components will be used and why?
- Preliminary conceptual drawing of robot design
- Cost estimate
- Major components of design listed
- Miscellaneous category listed
- Projected labor listed
- Microsoft Project schedule
- Click here to access the guide on how to transfer a file
- Teamwork agreement summary
- Summary
- Overall assessment on current state of project
- Is the project on schedule? Is it on budget?
- Next steps and future tasks
Look Ahead: What tasks are planned between now and Milestone 2?
Benchmark Assessment A
Benchmarks evaluate the progress of the project. Benchmark A is due at the end of Model Shop Session II. There are penalties for not completing this on time. Refer to the EG1004 Grading Policy for more information.
To pass Benchmark A, the design must complete all of the following:
- Obtain first water source reading
Milestone 2
See How To Give a Milestone Presentation for the format of a Milestone presentation.
Milestone 2 Deliverables:
- Presentation:
- Project description
- Design approach
- Design changes since Milestone 1
- Mission statement
- CAD drawings: top, front, most detailed side, isometric, gear train
- Mindstorms program
- Updated cost estimate (previous and current). What changes were made?
- Updated Microsoft Project schedule (previous and current). What changes were made?
- Progress update: current state of the project (time, budget, etc.)
Look Ahead: What tasks are planned between now and Milestone 3?
Benchmark Assessment B
Benchmark Assessment B is due at the end of Model Shop Session III. There are penalties for not completing this on time. Refer to the EG1004 Grading Policy for more information.
To pass, complete all of the following tasks:
- Obtain first water source reading
- Return to shuttle to clean sensor
- Obtain second water source reading
Milestone 3
See How To Give a Milestone Presentation for the format of a Milestone presentation.
Milestone 3 Deliverables:
- Presentation:
- Project description
- Design approach
- Design changes since Milestone 2
- Mission statement
- CAD drawings: top, front, most detailed side, isometric, gear train
- Mindstorms program
- Updated cost estimate (previous and current). What changes were made?
- Updated Microsoft Project schedule (previous and current). What changes were made?
- Progress update: current state of the project (time, budget, etc.)
Look ahead: What tasks are planned between now and the completion of the project?
Commissioning
Projects must be commissioned before Submission. Refer to the syllabus for Submission deadlines. There are penalties for not completing this on time. Refer to the EG1004 Grading Policy for more information.
To pass, the design must complete all of the following:
- Obtain two water source readings and make it back to the space shuttle
- Graph of density vs salinity
- Answered questions from Data Specifications: Main Tasks
- Note: All questions and answers (including formulas and calculations as well as explanations) must be neatly typed on a MS Word Document.
Final Presentation
The Final Presentation will be a technical briefing, similar to the Milestones, but also serves as a sales presentation explaining why your company should be selected instead of the competition.
Your Final Presentation must include:
- Company profile
- Company name
- Employee profile, role(s), and qualifications
- Mission statement
- Problem statement
- Why is the project happening?
- What does the audience need to know?
- Project objective
- What is the purpose of your project?
- Who does your project help?
- What problem does your project solve?
- Project description
- Specify LEED certification
- Examples of LEED implementations in Revit
- Revit drawings
- All floor plan drawings
- Dimensions
- 1:240 scale
- Views of exterior of building: front elevation, side elevation, isometric elevation
- Dimensions
- Specify LEED certification
- Market and product viability
- Does your company have competitors?
- What makes your project unique?
- How does your design compare to competitors - cost, quality, features?
- Is the project versatile?
- What is the price of your project?
- Conclusion
- Reiterating project purpose
- Highlight project features
- Future goals of the company
- Why should your company be awarded this contract?
- Video pitch
- Price of project
- Walkthrough animation of building in Revit
- Embedded into Final Presentation
- Problem statement
- Solution overview
- Company description and qualifications
- Drawings
- Mindstorms program
- Cost estimate
- Microsoft Project schedule
- Video demonstration
- Why should the company be awarded this contract?
Submission
All SLDPs must be submitted online. Please visit this page for the link to the Project Submission form and each project’s individualized login information. To submit, login to the EG1004 website using this special login information. Submitting with an NYU account or any other account will generate an error. Components may be resubmitted at any time before the deadline. Please note that submission times are based on the most recent submission.
Please note the deliverables for this project are as follows. If any of the following items are omitted, there will be a penalty. Be sure to click "Submit" at the bottom of the form and allow sufficient time for uploading. The following list includes deliverable items that are required:
- Submission deliverables:
- Final presentation
- Cover page and table of contents
- Final Mindstorms program
- Initial sketch
- All the drawings of your design (initial through final)
- Video
- Final MS Project Schedule
- Final cost estimate
- Resume(s) (No fictitious resumes will be accepted.)
- Density vs salinity graph
- Questions and answers asked in Data Specifications: Main Tasks
Late Submission
Late submission is not allowed. If a project does not Commission or receive Partial Commission by the deadline set forth in the syllabus, the project will not be allowed to submit and will receive a 0 for the project grade. To receive Partial Commissioning, two TAs must evaluate the project and determine its degree of completion according to the Commissioning requirements and the project will be given a grade accordingly. Please refer to the EG1004 Grading Policy for more information.
Appendix: Programming with Vernier Sensors
In order to program the NXT/EV3 to obtain a reading using a Vernier sensor, a special sensor block that must be used. This block does not initially come with the NXT Mindstorms or EV3 programs, but can be easily downloaded. The computers in the Model Shop and all the EG lab rooms already have this sensor block on the programs. If you would like to download it onto your own computer, please look at the instructions below, which apply to both the NXT and the EV3 sensor blocks.
Downloading the Sensor Block: NXT
The sensor block can be downloaded from the Vernier website at [www.vernier.com www.vernier.com]. Once at the website, search for "Vernier NXT Sensor Block" and click on the first link on the search results page. Your page should look like the one in Figure 12.
Once at this webpage, click on "Download Vernier Sensor Block – Version 2.0" and save the "Vernier Sensor" folder to a place where it can be accessed easily.
Start NXT 2.0 Programming on your computer. At the top of the screen click on "Tools" -> "Block Import and Export Wizard." A screen will pop up that looks like the one in Figure 13.
Click on "Browse" and search for the "Vernier Sensor" file that was recently downloaded from the Vernier website. After a few seconds, the words "Vernier Sensor" will appear in the box under "Name." Click on the name and change the "Advanced" tab to "Sensors." This ensures that the sensor block will appear in the sensors palette with all of the other sensor blocks. Finally, hit import and the file will be downloaded and can be located in the sensor palette.
Downloading the Sensor Block: EV3
The instructions are the same for downloading the EV3 sensor block. On [www.vernier.com www.vernier.com], search for "Vernier EV3 Sensor Block" and click on the first link on the search results page.
Once at this webpage, click on "Download Vernier EV3 Sensor Block – Version 0.79" and save the "Vernier Sensor Block.ev3b" folder to a place where it can be accessed easily.
Start the EV3 software on your computer. At the top of the screen click on "Tools" -> "Block Import." A screen will pop up that looks very similar to the one in Figure 13. Click on "Browse" and search for the "Vernier Sensor Block.ev3b" file that was recently downloaded from the website. After a few seconds, the words "Vernier Sensor Block.ev3b" will appear in the box under "Name." Click on the name and hit import; the file will be downloaded.
Using the Sensor Block: NXT
Start NXT 2.0 Programming on your computer and open a new program. On the left hand side of the window, click on the yellow sensors palette, a window of different sensors should be visible. Click and hold on to the Vernier Sensor icon and drag it onto the main frame. Extend the bottom of the Vernier sensor just as in Figure 14.
Click on the Vernier sensor block. At the bottom of the screen, change the port number to the port that the NXT sensor adapter is plugged into the NXT brick. Under the dropdown "Sensor" window, pick "Salinity." A meter with the numbers 0 – 50 should be seen to the right. This meter will move once the salinity sensor comes in contact with salt water and it is measured in ppt.
A sample program can be seen in Figure 15. In this program, the salinity in ppt that the Vernier salinity sensor reads will be displayed on the NXT brick for five seconds. The meter explained above can also be seen in Figure 15.
Using the Sensor Block: EV3
Start the EV3 software on your computer and open a new program. On the bottom of the window, click on the yellow sensors palette, different sensors should be visible at the bottom of the screen. Click and hold on to the Vernier Sensor icon and drag it onto the main frame.
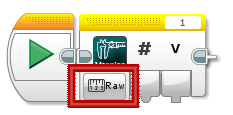
On the Vernier sensor block there should be button that says "Raw" right underneath the green picture that says Vernier. This button is shown in Figure 16.
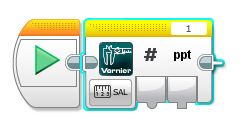
After the button is pressed go to "Measure" -> "More Sensors" -> "Salinity ppt." You should see that the image looks like the one in Figure 17.
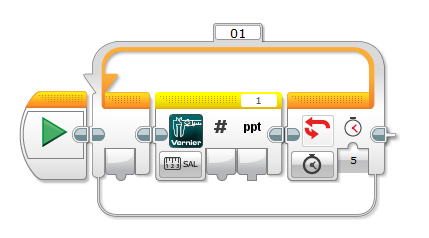
Now, we are going to create a program to make the robot continuously measure the salinity for five seconds and display the reading on the EV3 brick. To do this, we must input a loop that can be found under the orange palette. Drag the loop onto the main frame. Click on the infinity symbol under the red arrows on the loop switch and change it to time, which can be found all the way at the bottom. Change the number to the right of the button to five. It should now look like the program in Figure 18.
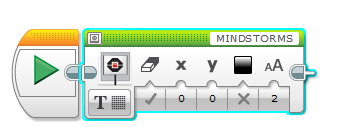
We are now going to have the salinity reading display on the EV3 brick. Go to the green palette at the bottom of the program, click on the display block and drag it onto the main frame. On the display block, click on the image folder and go to text, then pixels. The block should look like the one in Figure 19.
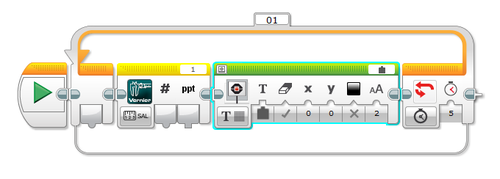
At the top of the display sensor block, the name "MINDSTORMS" is displayed. Click on the name and change it to "Wired." The block should look exactly the same except with one more slot immediately to the left of the spot with the check mark. Input the display block into the loop previously made and wire it like the picture in Figure 20. This program will now allow the salinity sensor to read the measurement and display it on the brick for five seconds.
| ||||||||
