Difference between revisions of "Product Evaluation and Quality Improvement"
(removal of HTTPS EG links) |
(1003 --> 1004) |
||
| (16 intermediate revisions by the same user not shown) | |||
| Line 1: | Line 1: | ||
== | = Objectives = | ||
The objectives of this lab are to use product evaluation to determine if a robot design meets minimum standards for accuracy and precision, to use a quality improvement process to modify the robot design, to evaluate the modified robot design, and to use the data from the product evaluation of both robots to determine if the original robot or the modified robot should go into production. | |||
= Overview = | |||
A specified robot design will be assembled using an NXT robotics kit. That design will be evaluated for its accuracy and precision in a distance test and an angle of deviation test. The results of that testing will be compared to a standard that will be set prior to testing. Using reverse engineering, the robot will be disassembled, analyzed, and quality improvements will be made to the design. The modified design will undergo the distance test and angle of deviation test. The data from the product evaluation of both robots will be used to determine if the original robot or the modified robot should go into production. | |||
accuracy and precision and to | |||
== Product Evaluation == | |||
Product evaluation is a common task for an engineer and for companies. Sometimes the product evaluated will be a company's product, and sometimes companies will be evaluating a competitor's design. In either case, this evaluation will use a '''''standard''''' (an accepted value), determine an '''''average''''', and calculate '''''accuracy''''' and '''''precision'''''.<ref name="one">Oakes, W.C., L.L. Leone, and C.G. Gunn, ''Engineering Your Future'', MI: Great Lakes Press, 2002.</ref> | |||
Professional engineers must be sure of standards. For the purpose of this lab, the EG1004 Standard will be 80% precision and accuracy. This means that the product has to achieve a percent accuracy and percent precision of 80 percent and it has to pass 80 percent of the tests that it undergoes.<ref name="one"></ref> | |||
Professional engineers must be sure of | |||
standards. For the purpose of this lab, the | |||
When taking measurements, the first step is to determine an average. | When taking measurements, the first step is to determine an average. | ||
| Line 47: | Line 14: | ||
<math>Average\left(A_p\right) = \frac{P_1+P_2+P_3+...+P_n}{N}\,</math> | <math>Average\left(A_p\right) = \frac{P_1+P_2+P_3+...+P_n}{N}\,</math> | ||
In this equation, < | In this equation, ''A<sub>p</sub>'' is the average, ''P<sub>1</sub>'', ''P<sub>2</sub>'', ''P<sub>3</sub>'', ''...'', ''P<sub>n</sub>'' are the results of the tests and ''N'' is the total number of tests performed. | ||
is the average, < | |||
performed. | |||
The '''''average''''' is | The '''''average''''' is compared to the '''''standard'''''. Accuracy is a variable the must always be considered. The degree of accuracy required will allow the results to be verified. Engineers often work on projects that affect people's safety; it is critical that the solutions to the problems solved by technical professionals are '''''accurate'''''. | ||
compared to the '''''standard'''''. Accuracy is a variable | |||
technical professionals are '''''accurate'''''. | |||
The comparison of the average to the | The comparison of the average to the standard is called accuracy, defined as ''Acc'' in the following equation: | ||
standard is called accuracy, defined as | |||
<math>Acc = \left|P_s - A_p\right|\,</math> | <math>Acc = \left|P_s - A_p\right|\,</math> | ||
In this equation, < | In this equation, ''P<sub>s</sub>'' is the standard value, and ''A<sub>p</sub>'' is the value measured. Accuracy is always a positive number, so use the absolute value in case ''P<sub>s</sub>'' is less than ''A<sub>p</sub>''. | ||
standard value, and < | |||
a positive number, so | |||
than < | |||
Precision is the repeatability of a | Precision is the repeatability of a result, or how close the results are to each other, defined as ''Prec'' in the following equation: | ||
result, or how close the results are to each other, defined as ''Prec'' in | |||
the following equation: | |||
<math>Prec = \left|P_{high} - P_{low}\right|\,</math> | <math>Prec = \left|P_{high} - P_{low}\right|\,</math> | ||
In this equation, | In this equation, ''Prec'' is precision, ''P<sub>high</sub>'' is the highest data value and ''P<sub>low</sub>'' is the lowest data value. Like accuracy, precision is always a positive number, so use an absolute value here as well. | ||
is the lowest data value. Like accuracy, precision is always a positive number, | |||
so | |||
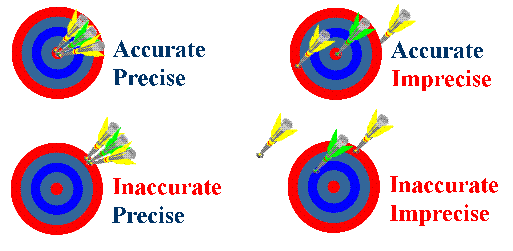
A product test can be accurate but | A product test can be accurate but imprecise, or precise but inaccurate (Figure 1). The goal is always the combination of accuracy and precision. In order for engineers to make a recommendation based on experimental test data, it is important to determine how a product compares to a standard. Engineers need these benchmarks to determine the quality of a product. | ||
imprecise, or precise but inaccurate. The goal is always the combination of | |||
accuracy and precision. In order for engineers to make a recommendation based | |||
on experimental test data, it is important to determine how a | |||
a product. | |||
[[Image:Lab hardsyn 12.gif]] | [[Image:Lab hardsyn 12.gif|frame|center|Figure 1: Accuracy and precision.]] | ||
By determining the percent accuracy of | By determining the percent accuracy of an experiment, and comparing this percentage to a standard, it can be determined, based on experimental evidence, if the product has passed or failed. The equation for percent accuracy is: | ||
an experiment, and comparing this percentage to a standard, | |||
based on experimental evidence, | |||
equation for percent accuracy is: | |||
<math>%Acc = \left ( 1 - \frac{ \left | P_s - A_p \right | }{P_s} \right ) \times 100%\,</math> | <math>%Acc = \left ( 1 - \frac{ \left | P_s - A_p \right | }{P_s} \right ) \times 100%\,</math> | ||
In this equation, | In this equation, ''%Acc'' is the percent accuracy, ''P<sub>s</sub>'' is the standard value, and ''A<sub>p</sub>'' is the value measured. | ||
percent accuracy, < | |||
is the value | |||
Percent accuracy | Percent accuracy shows how precise a product is compared to the standard. The equation for percent precision is: | ||
percent precision is: | |||
<math>%Prec = 100e^{-BP}\,</math> | <math>%Prec = 100e^{-BP}\,</math> | ||
In this equation, | In this equation, ''%Prec'' is the percent precision, ''B'' is the exponential decay factor, and ''P'' is the precision measured. Each individual test requires the use of a different exponential decay factor (''B''): | ||
: Distance Test: | : Distance Test: ''B'' = 0.0972 | ||
: Angle of Deviation Test: | : Angle of Deviation Test: ''B'' = 0.0323 | ||
Calculating percent accuracy and percent | Calculating percent accuracy and percent precision and then comparing those results to a standard determines the quality of the product. | ||
precision and then comparing | |||
== Quality Improvement == | |||
Quality improvement is a process of analyzing a design and testing it either through physical modeling, computer simulation, or mathematical modeling. Quality improvement ensures that a product will perform as expected and allows improvements to be made to the design. | |||
When deciding how to improve the design in this lab, keep these questions in mind: | |||
When deciding how to improve the design, keep these questions in mind: | |||
* Does the robot perform to standard? | * Does the robot perform to standard? | ||
** If no, what can be done to improve its functionality? | ** If no, what can be done to improve its functionality? (Drive train, maneuverability, power output, programming, traction) | ||
** If yes, what can be done to improve its performance beyond the standard? | ** If yes, what can be done to improve its performance beyond the standard? | ||
Changes will be implemented after testing the initial design. | |||
== Reverse Engineering == | |||
Reverse engineering software involves reversing a program's machine code to obtain the original source code or determine the file structures the program uses. This needs to be done when source code is lost or is not available. For example, when a project is reactivated after being dormant for years to add new features to a product, the original design documentation may have disappeared. Also, when companies are writing a program that must interface to a second company's software, the second company may not have any incentive to cooperate by describing how the data in the files they use are organized, forcing the first company to deduce it on their own. Sometimes, this process is also undertaken as a way to improve the performance of a program, to fix a bug, or to find a virus. When the source code is obtained in this way for any of these reasons it is legal and necessary. Reverse engineering software in order to copy it constitutes a copyright violation and is illegal.<ref name="two">''What Is ''website. TechTarget Network. Retrieved July 29th, 2003.</ref> | |||
Hardware reverse engineering involves taking apart a device to see how it works. If a processor manufacturer wants to see how a competitor's processor works, the company can purchase the processor, disassemble it, and then make a new processor similar to it. In some countries, this process is illegal. Hardware reverse engineering is quite expensive and requires an expert in the field.<ref name="two"></ref> | |||
it | |||
and | |||
When beginning the process of reverse engineering the robot, identifying the gear trains and the individual gears used in the original design and in the final design is critical to understanding the robot's operation. | |||
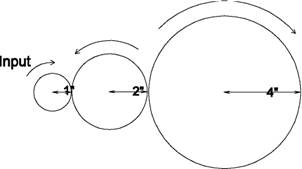
There are two types of gear trains: simple (Figure 2) and compound (Figure 3). A simple gear train has its gears arranged in a line (see Figure 1). | |||
[[Image:Lab reveng 1.jpg|frame|center|Figure 2: Simple gear train.]] | |||
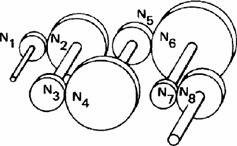
Compound gear trains use axles to connect the component gears (see Figure 3). | |||
Compound gear | [[Image:Lab reveng 2.jpg|frame|center|Figure 3: Compound gear train.]] | ||
Gear trains have measurable characteristics known as gear ratio and velocity ratio. These characteristics are inversely proportional. Gear ratio equals output over input, while velocity ratio equals input over output. If multiple gears are being used, the gear ratio and velocity ratio are the product of these ratios for each individual gear. To determine input and output values, engineers count the number of teeth on each gear or by measuring each gear's radius. | |||
For example, to compute the gear ratio of the gear trains in Figures 2 and 3, these formulas (Figure 4) are used, where the values are the radii of the gears in the gear train: | |||
the | |||
{| class="wikitable" style="text-align: center; margin: 0px auto;" | |||
|+ style="caption-side: bottom;" | Figure 4: Gear ratio. | |||
{| | |||
|<math>Gear Ratio = \frac{2}{1} \times \frac{4}{2} = 4\,</math><br />Simple gear train | |<math>Gear Ratio = \frac{2}{1} \times \frac{4}{2} = 4\,</math><br />Simple gear train | ||
|<math>Gear Ratio = \frac{N_2}{N_1} \times \frac{N_4}{N_3} \times \frac{N_6}{N_5} \times \frac{N_8}{N_7}\,</math><br />Compound gear train | |<math>Gear Ratio = \frac{N_2}{N_1} \times \frac{N_4}{N_3} \times \frac{N_6}{N_5} \times \frac{N_8}{N_7}\,</math><br />Compound gear train | ||
|} | |} | ||
For example, to compute the velocity ratio of the gear trains above, | For example, to compute the velocity ratio of the gear trains above, these formulas (Figure 5) are used: | ||
{| | {| class="wikitable" style="text-align: center; margin: 0px auto;" | ||
|+ style="caption-side: bottom;" | Figure 5: Velocity ratio. | |||
|<math>Velocity Ratio = \frac{1}{2} \times \frac{2}{4} = \frac{1}{4}\,</math><br />Simple gear train | |<math>Velocity Ratio = \frac{1}{2} \times \frac{2}{4} = \frac{1}{4}\,</math><br />Simple gear train | ||
|<math>Velocity Ratio = \frac{N_1}{N_2} \times \frac{N_3}{N_4} \times \frac{N_5}{N_6} \times \frac{N_7}{N_8}\,</math><br />Compound gear train | |<math>Velocity Ratio = \frac{N_1}{N_2} \times \frac{N_3}{N_4} \times \frac{N_5}{N_6} \times \frac{N_7}{N_8}\,</math><br />Compound gear train | ||
|} | |} | ||
It is important to note that the input | It is important to note that the input is the source of rotation in a system, like a motor, and the output is the final gear of rotation in a system, like a wheel. | ||
is the source of rotation in a system, like a motor, and the output is the | |||
final gear of rotation in a system, like a wheel. | |||
{| | {| class="wikitable" style="text-align: center; margin: 0px auto;" | ||
|+ | |+ style="caption-side: bottom;" | Figure 6: Types of Gears<br />Figures 6a-d courtesy of http://www.howthingswork.com<br />Figure 6f courtesy of Honda Motor Company, Inc. | ||
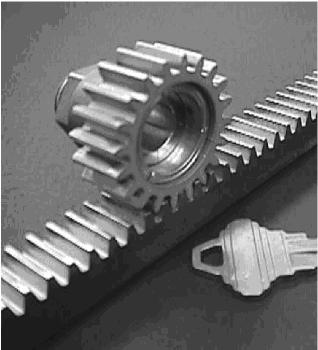
|[[Image:Lab reveng 7.jpg|frame|center|'''Figure | |[[Image:Lab reveng 7.jpg|frame|center|'''Figure 6a: Rack gear.''' Its purpose is to change rotation into linear motion.]] | ||
|[[Image:Lab reveng 8.jpg|frame|center|'''Figure | |[[Image:Lab reveng 8.jpg|frame|center|'''Figure 6b: Crown gear.''' Its purpose is to change the direction of rotation perpendicularly.]] | ||
|- | |- | ||
|[[Image:Lab reveng 9.jpg|frame|center|'''Figure | |[[Image:Lab reveng 9.jpg|frame|center|'''Figure 6c: Spur gear.''' Its purpose is to transmit torque through the gear train.]] | ||
|[[Image:Lab reveng 10.jpg|frame|center|'''Figure | |[[Image:Lab reveng 10.jpg|frame|center|'''Figure 6d: Worm gear.''' Its purpose is to change the direction of rotation perpendicularly.]] | ||
|- | |- | ||
|[[Image:Lab reveng 11.jpg|frame|center|'''Figure | |[[Image:Lab reveng 11.jpg|frame|center|'''Figure 6e: Idler gear.''' Its purpose is to transfer force while not affecting the gear or velocity ratios.]] | ||
|[[Image:Lab reveng 12.jpg|frame|center|'''Figure | |[[Image:Lab reveng 12.jpg|frame|center|'''Figure 6f: Pulley gear.''' Its purpose is to transmit rotation from one point to one or more other points.]] | ||
|} | |} | ||
The objective of reverse engineering the robot is to understand how it works and to calculate the gear and velocity ratios for its drive train (remember the wheels are part of the drive train). Remember that engineers reverse engineer products to reproduce or improve them. As the robot is disassembled, improvements to the robot's design should be considered. | |||
ratios for its drive train (remember the wheels are part of the drive train). | |||
Remember that engineers reverse engineer products to reproduce or improve them. | |||
As | |||
'''Note''': Using gear and velocity ratios have proven to be extremely helpful when building robots for your EG1004 Semester-Long Design Project. | |||
= Design Considerations = | |||
* If | Carefully consider the desired results and what needs to be done to achieve it: | ||
* What made or will make the results inconsistent? | |||
* If the robot failed a test, why did it fail? | |||
== | = Materials and Equipment = | ||
* Mindstorms kit | |||
* Computer with Mindstorms software | |||
* Protractor and ruler | |||
* Graph paper | |||
= Procedure = | |||
== Problem Statement == | |||
Evaluate a robot design by building a specified robot design. Test the robot design, make improvements on the design, and retest it. While taking it apart, analyze the drive train. | |||
# Build a robot according to the design assigned by the TA. | |||
# Start the Mindstorms Program. On the welcome screen, type in a name for the program and press Go. | |||
#: [[Image:Lab hardsyn 2.jpg|thumb|center|640px]] | |||
# Click on Complete Palette to see all the programming icons. Turn off Robot Educator by clicking the small X. | |||
#: [[Image:Lab hardsyn 3.jpg|thumb|center|640px]] | |||
# The screen should look like this. Write a program. | |||
#: [[Image:Lab hardsyn 4.jpg|thumb|center|640px]] | |||
# Click on Actions, then on the Motor icon to select it. | |||
#: [[Image:Lab hardsyn 5.jpg|thumb|center|640px]] | |||
# Place the Motor icon on to the Start square. | |||
#: [[Image:Lab hardsyn 6.jpg|thumb|center|640px]] | |||
# Click the Motor icon to see its properties. Define exactly how the motor should spin and when to stop. | |||
#: [[Image:Lab hardsyn 7.jpg|thumb|center|640px]] | |||
# Continue writing the program by placing icons after each other. The execution of the program will run from left to right. In the sample program below, Motor A will spin forward for five seconds, stop, wait five seconds, and then spin backward for another five seconds. | |||
#: [[Image:Lab hardsyn 8.jpg|thumb|center|640px]] | |||
# For this lab, use the Move icon to easily instruct the robot to move. | |||
#: [[Image:Lab hardsyn 9.jpg|thumb|center|640px]] | |||
# When needed to, use Robot Educator to quickly learn how to program in Lego Mindstorms. | |||
#: [[Image:Lab hardsyn 10.jpg|thumb|center|640px]] | |||
Program and test the robot for each test specified. To do this, make a list of the tests. Brainstorm what the robot should do in each test. Then, write the program. Record the standard, average, accuracy, and precision. If the robot does not operate correctly, troubleshoot the problem. The TA must initial the original data. | |||
and | |||
'''Note:''' The initial program cannot be used for the following tests. | |||
'''Note:''' | == Distance Test == | ||
'''Note:''' Use centimeters for this test.'' | |||
In this test, the robot will go forward a set distance in a specified time. Test the robot's accuracy and precision for this distance. Before testing begins, the standard must be found. To find the standard, program the robot to go forward for five seconds and measure the distance it travels. Divide the result by five, and then multiply by four. This number is the standard. | |||
<math>P_s = \frac{distance\ traveled\ in\ 5\ seconds}{5} \times 4\,</math> | |||
Once the standard has been obtained, the testing can begin. | |||
begin. | |||
'''Warning: Read the section on the [[#Angle of Deviation Test|Angle of Deviation Test]] before performing this test. | [[Image:ProdEval1.png|thumb|480px|right|Figure 4: Sample drawing paper with data. The green line represents the five-second standard measurement. The blue lines represent the five four-second trials.]] | ||
'''Warning:''' Read the section on the [[#Angle of Deviation Test|Angle of Deviation Test]] before performing this test. | |||
# Upload a program that will | # Upload a program that will prompt the robot to travel for 4 seconds. | ||
# Measure the distance traveled. | # Measure the distance traveled. | ||
# Repeat this test | # Repeat this test five times. | ||
== Angle of Deviation Test == | |||
'''Note:''' This test is performed at the same time as the Distance Test. Since the robot is expected to travel in a straight line, the standard is 360°. | |||
<math>P_s = 360^\circ\,</math> | |||
In this test, the robot will move forward for four seconds and the angle of deviation will be recorded. The angle of deviation is the angle between a straight line and a line drawn from the starting point to where the robot finishes. | |||
# Use a protractor to draw a 0° line from the start point. | # Use a protractor to draw a 0° line from the start point. | ||
# Mark the start point and place | # Mark the start point and place the robot there. Identify a reference point on the robot. | ||
# Run the Distance Test. | # Run the Distance Test. | ||
# Make a mark at the point where the robot finished, and draw a line from the start point to this mark. | # Make a mark at the point where the robot finished, and draw a line from the start point to this mark. | ||
# Measure the positive angle of deviation. | # Measure the positive angle of deviation. | ||
# Repeat this procedure | # Repeat this procedure five times. | ||
<br style="clear: both;" /> | |||
== Quality Improvement == | |||
# Assess the robot design from data collected and from observations. | |||
# Assess | |||
# Make necessary adjustments. | # Make necessary adjustments. | ||
# Retest robot and collect data. | # Retest the robot and collect data. | ||
# Take pictures of both original design and | # Take pictures of both the original design and the modified design. | ||
== Reverse Engineering == | |||
# Visually assess the robot's design. Consider how it works. | # Visually assess the robot's design. Consider how it works. | ||
# Sketch the front, top, and most detailed side of the robot. Be sure to include dimensions in | # Sketch the front, top, and most detailed side of the robot. Be sure to include dimensions in the sketch. | ||
# Also sketch the most detailed view of the gear train. | # Also sketch the most detailed view of the gear train. | ||
# Before disassembling | # Before disassembling the robot, ask the TA to take a picture of it. | ||
# Disassemble the robot. Analyze its inner workings and sketch the gear train(s). Note: All sketches in | # Disassemble the robot. Analyze its inner workings and sketch the gear train(s). Note: All sketches in EG1004 must be done in pencil. | ||
# Have all sketches and original data signed by | # Have all sketches and original data signed by the TA. | ||
With measurements for both tests performed and an analysis of the drive train of the robot, data analysis must begin. Calculate the average, accuracy, and precision for each test. Compare the results to the standard in order to determine if the robot is accurate and precise. Label all major components and describe their functions. Calculate percent accuracy and percent precision. Calculate the gear and velocity ratios. | |||
test. Compare | |||
is accurate and precise. Label all major components and describe their | |||
functions. Calculate the gear and velocity ratios | |||
:'''Examples''' | |||
:* If ''P<sub>s</sub>'' was 5cm and ''A<sub>p</sub>'' was 7cm, then the percent accuracy (''%Acc'') is 60%. This test does not pass the 80% criterion. | |||
:* If ''P<sub>s</sub>'' was 5cm and ''A<sub>p</sub>'' was 25cm, then the result of the percent accuracy equation is -300%. Since a negative percentage has no meaning in engineering, it can be said that the product has a percent accuracy of zero. Any percent accuracy less than zero is equal to zero. | |||
:* If ''P<sub>s</sub>'' was 10cm and ''A<sub>p</sub>'' was 8cm, then the percent accuracy is exactly 80%, which is a passing result. | |||
:* For the Distance Test, if the precision (''P'') was 0.5cm, the percent precision (''%Prec'') is 95.3%. This robot passes the 80% criterion for this test. | |||
:* For the Angle of Deviation Test, if the precision (''P'') was 10.25°, the percent precision (''$Prec'') is 71.8%. This robot does not pass the 80% criterion. | |||
To decide if the product is ready to | == Tabulation of Results == | ||
manufacture, arrange | To decide if the product is ready to manufacture, arrange the data in a table designed to calculate its precision and accuracy. Remember it must pass all the tests at a rate of at least 80%. | ||
and accuracy. Remember it must pass all the tests at a rate of at least 80%. | |||
{| | {| class="wikitable" style="text-align: center; margin: 0px auto;" | ||
! !! Accuracy !! | ! Original Design !! Accuracy !! ''%Acc'' !! Pass/Fail !! Precision !! ''%Prec'' !! Pass/Fail | ||
|- | |- | ||
! Distance Test || || || || || || | ! Distance Test || || || || || || | ||
| Line 357: | Line 216: | ||
|} | |} | ||
Retest with new design using the same | Retest with new design using the same table, record the data. | ||
table, record | |||
== | {| class="wikitable" style="text-align: center; margin: 0px auto;" | ||
! New Design !! Accuracy !! ''%Acc'' !! Pass/Fail !! Precision !! ''%Prec'' !! Pass/Fail | |||
|- | |||
! Distance Test || || || || || || | |||
|- | |||
! Angle of Deviation Test || || || || || || | |||
|} | |||
The lab work is now complete. Please clean up the workstation. Return all unused materials to the TA. Refer to the [[#Assignment|Assignment]] section for the instructions needed to prepare the lab report. | |||
= Assignment = | |||
== Individual Lab Report == | |||
Follow the lab report guidelines laid out in the page called [[Specifications for Writing Your Lab Reports]] in the ''Technical Communication'' section of this manual. The following discussion points should be addressed in the appropriate section of the lab report: | |||
* Discuss product evaluation and the need for it. | |||
* Discuss quality improvement and its importance. | |||
* Explain why reverse engineering is important. | |||
* Discuss a standard, an average, accuracy, and precision. | |||
* Discuss the NXT kit and software used. | |||
* Assess the techniques used in the testing process. | |||
* Discuss better testing methods for the robot design. | |||
* Describe how the components fit together and how the device was constructed. | |||
* Describe and show how the gear and velocity ratios were calculated, and discuss their importance in the overall robot design as well. | |||
* Analyze the original robot design and the final design then make a decision which design is better. Remember to substantiate the decision with the data, observations, and facts collected. | |||
* Make a final evaluation of the product: should it go into production? Describe its accuracy and precision. | |||
* Discuss the importance of ''%Prec'' and ''%Acc'' in determining product quality. | |||
* Recommend if any design improvements should be made. | |||
{{Lab notes}} | |||
== Team PowerPoint Presentation == | |||
Follow the presentation guidelines laid out in the page called [[EG1004 Lab Presentation Format]] in the ''Introduction to Technical Presentations'' section of this manual. When preparing the presentation, consider the following points: | |||
* Based on the test results, what is the product's marketability? | |||
* If determinations were negative, what improvements could be made? | |||
* Why is product evaluation important? | |||
* Discuss why quality improvement is important. | |||
* Discuss the importance of gear and velocity ratios. | |||
= Footnotes = | |||
{{Reflist}} | |||
{{Laboratory Experiments}} | |||
Latest revision as of 02:27, 31 August 2022
Objectives
The objectives of this lab are to use product evaluation to determine if a robot design meets minimum standards for accuracy and precision, to use a quality improvement process to modify the robot design, to evaluate the modified robot design, and to use the data from the product evaluation of both robots to determine if the original robot or the modified robot should go into production.
Overview
A specified robot design will be assembled using an NXT robotics kit. That design will be evaluated for its accuracy and precision in a distance test and an angle of deviation test. The results of that testing will be compared to a standard that will be set prior to testing. Using reverse engineering, the robot will be disassembled, analyzed, and quality improvements will be made to the design. The modified design will undergo the distance test and angle of deviation test. The data from the product evaluation of both robots will be used to determine if the original robot or the modified robot should go into production.
Product Evaluation
Product evaluation is a common task for an engineer and for companies. Sometimes the product evaluated will be a company's product, and sometimes companies will be evaluating a competitor's design. In either case, this evaluation will use a standard (an accepted value), determine an average, and calculate accuracy and precision.[1]
Professional engineers must be sure of standards. For the purpose of this lab, the EG1004 Standard will be 80% precision and accuracy. This means that the product has to achieve a percent accuracy and percent precision of 80 percent and it has to pass 80 percent of the tests that it undergoes.[1]
When taking measurements, the first step is to determine an average.
In this equation, Ap is the average, P1, P2, P3, ..., Pn are the results of the tests and N is the total number of tests performed.
The average is compared to the standard. Accuracy is a variable the must always be considered. The degree of accuracy required will allow the results to be verified. Engineers often work on projects that affect people's safety; it is critical that the solutions to the problems solved by technical professionals are accurate.
The comparison of the average to the standard is called accuracy, defined as Acc in the following equation:
In this equation, Ps is the standard value, and Ap is the value measured. Accuracy is always a positive number, so use the absolute value in case Ps is less than Ap.
Precision is the repeatability of a result, or how close the results are to each other, defined as Prec in the following equation:
In this equation, Prec is precision, Phigh is the highest data value and Plow is the lowest data value. Like accuracy, precision is always a positive number, so use an absolute value here as well.
A product test can be accurate but imprecise, or precise but inaccurate (Figure 1). The goal is always the combination of accuracy and precision. In order for engineers to make a recommendation based on experimental test data, it is important to determine how a product compares to a standard. Engineers need these benchmarks to determine the quality of a product.
By determining the percent accuracy of an experiment, and comparing this percentage to a standard, it can be determined, based on experimental evidence, if the product has passed or failed. The equation for percent accuracy is:
In this equation, %Acc is the percent accuracy, Ps is the standard value, and Ap is the value measured.
Percent accuracy shows how precise a product is compared to the standard. The equation for percent precision is:
In this equation, %Prec is the percent precision, B is the exponential decay factor, and P is the precision measured. Each individual test requires the use of a different exponential decay factor (B):
- Distance Test: B = 0.0972
- Angle of Deviation Test: B = 0.0323
Calculating percent accuracy and percent precision and then comparing those results to a standard determines the quality of the product.
Quality Improvement
Quality improvement is a process of analyzing a design and testing it either through physical modeling, computer simulation, or mathematical modeling. Quality improvement ensures that a product will perform as expected and allows improvements to be made to the design.
When deciding how to improve the design in this lab, keep these questions in mind:
- Does the robot perform to standard?
- If no, what can be done to improve its functionality? (Drive train, maneuverability, power output, programming, traction)
- If yes, what can be done to improve its performance beyond the standard?
Changes will be implemented after testing the initial design.
Reverse Engineering
Reverse engineering software involves reversing a program's machine code to obtain the original source code or determine the file structures the program uses. This needs to be done when source code is lost or is not available. For example, when a project is reactivated after being dormant for years to add new features to a product, the original design documentation may have disappeared. Also, when companies are writing a program that must interface to a second company's software, the second company may not have any incentive to cooperate by describing how the data in the files they use are organized, forcing the first company to deduce it on their own. Sometimes, this process is also undertaken as a way to improve the performance of a program, to fix a bug, or to find a virus. When the source code is obtained in this way for any of these reasons it is legal and necessary. Reverse engineering software in order to copy it constitutes a copyright violation and is illegal.[2]
Hardware reverse engineering involves taking apart a device to see how it works. If a processor manufacturer wants to see how a competitor's processor works, the company can purchase the processor, disassemble it, and then make a new processor similar to it. In some countries, this process is illegal. Hardware reverse engineering is quite expensive and requires an expert in the field.[2]
When beginning the process of reverse engineering the robot, identifying the gear trains and the individual gears used in the original design and in the final design is critical to understanding the robot's operation.
There are two types of gear trains: simple (Figure 2) and compound (Figure 3). A simple gear train has its gears arranged in a line (see Figure 1).
Compound gear trains use axles to connect the component gears (see Figure 3).
Gear trains have measurable characteristics known as gear ratio and velocity ratio. These characteristics are inversely proportional. Gear ratio equals output over input, while velocity ratio equals input over output. If multiple gears are being used, the gear ratio and velocity ratio are the product of these ratios for each individual gear. To determine input and output values, engineers count the number of teeth on each gear or by measuring each gear's radius.
For example, to compute the gear ratio of the gear trains in Figures 2 and 3, these formulas (Figure 4) are used, where the values are the radii of the gears in the gear train:
Simple gear train |
Compound gear train |
For example, to compute the velocity ratio of the gear trains above, these formulas (Figure 5) are used:
Simple gear train |
Compound gear train |
It is important to note that the input is the source of rotation in a system, like a motor, and the output is the final gear of rotation in a system, like a wheel.
The objective of reverse engineering the robot is to understand how it works and to calculate the gear and velocity ratios for its drive train (remember the wheels are part of the drive train). Remember that engineers reverse engineer products to reproduce or improve them. As the robot is disassembled, improvements to the robot's design should be considered.
Note: Using gear and velocity ratios have proven to be extremely helpful when building robots for your EG1004 Semester-Long Design Project.
Design Considerations
Carefully consider the desired results and what needs to be done to achieve it:
- What made or will make the results inconsistent?
- If the robot failed a test, why did it fail?
Materials and Equipment
- Mindstorms kit
- Computer with Mindstorms software
- Protractor and ruler
- Graph paper
Procedure
Problem Statement
Evaluate a robot design by building a specified robot design. Test the robot design, make improvements on the design, and retest it. While taking it apart, analyze the drive train.
- Build a robot according to the design assigned by the TA.
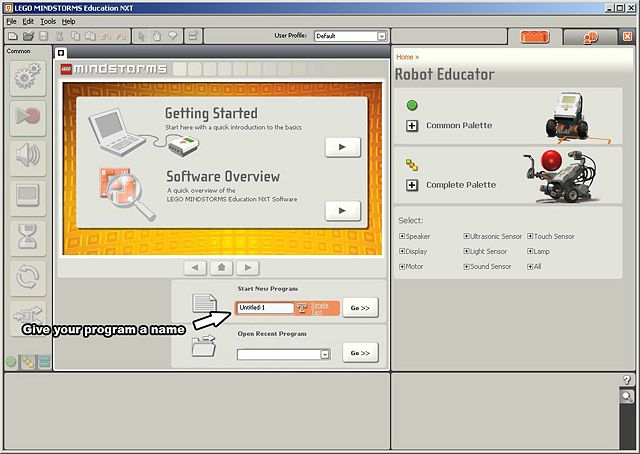
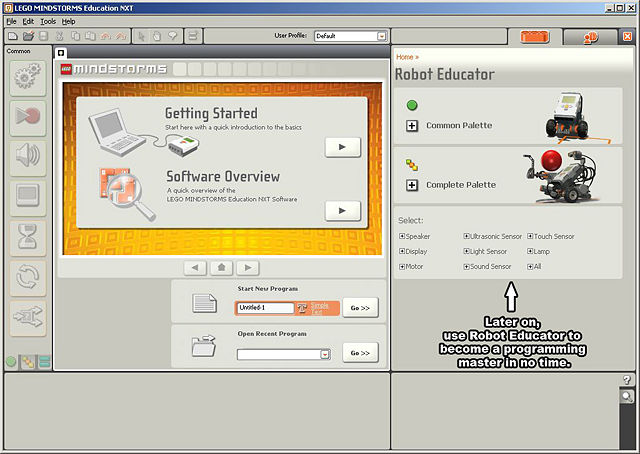
- Start the Mindstorms Program. On the welcome screen, type in a name for the program and press Go.
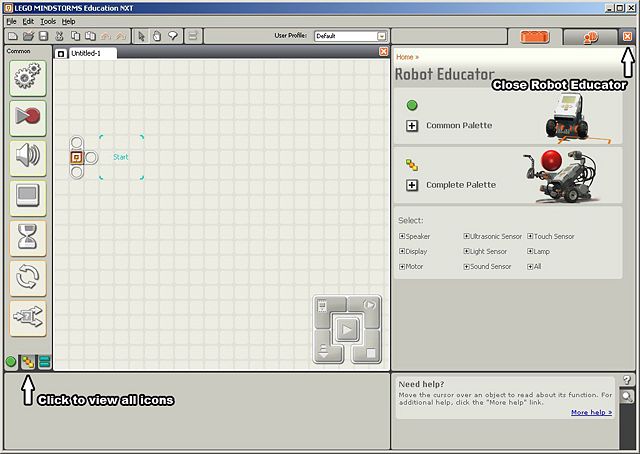
- Click on Complete Palette to see all the programming icons. Turn off Robot Educator by clicking the small X.
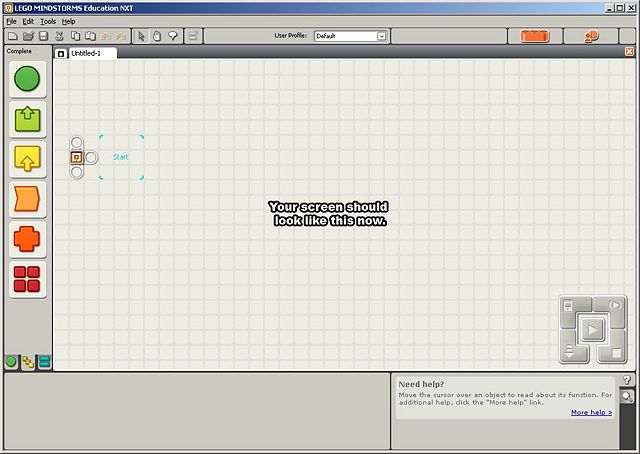
- The screen should look like this. Write a program.
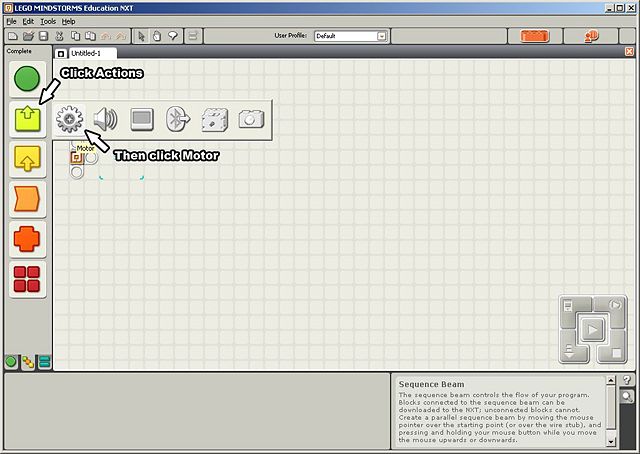
- Click on Actions, then on the Motor icon to select it.
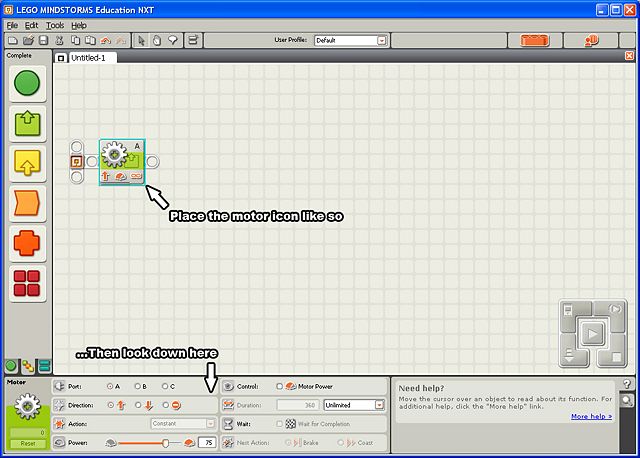
- Place the Motor icon on to the Start square.
- Click the Motor icon to see its properties. Define exactly how the motor should spin and when to stop.
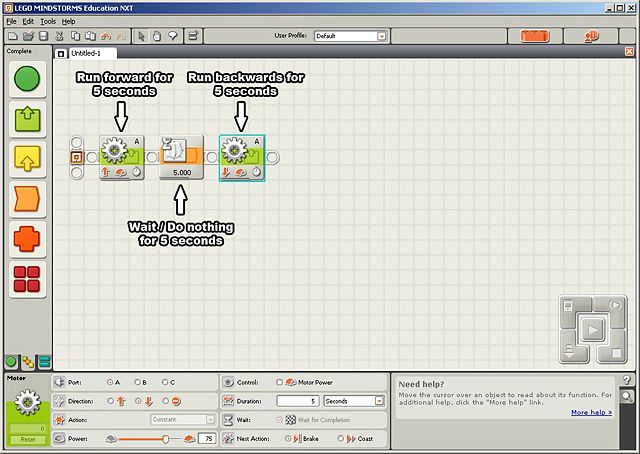
- Continue writing the program by placing icons after each other. The execution of the program will run from left to right. In the sample program below, Motor A will spin forward for five seconds, stop, wait five seconds, and then spin backward for another five seconds.
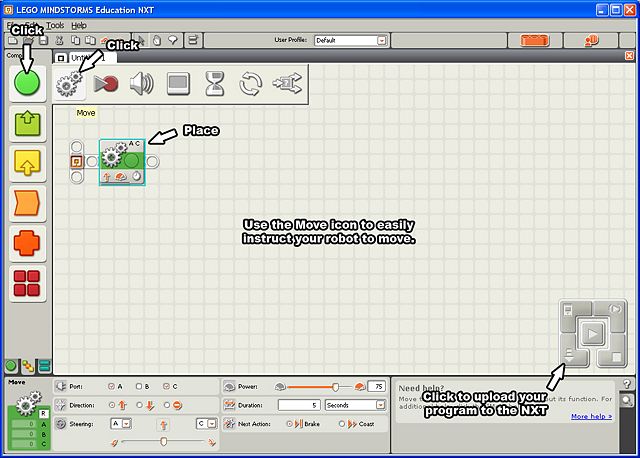
- For this lab, use the Move icon to easily instruct the robot to move.
- When needed to, use Robot Educator to quickly learn how to program in Lego Mindstorms.
Program and test the robot for each test specified. To do this, make a list of the tests. Brainstorm what the robot should do in each test. Then, write the program. Record the standard, average, accuracy, and precision. If the robot does not operate correctly, troubleshoot the problem. The TA must initial the original data.
Note: The initial program cannot be used for the following tests.
Distance Test
Note: Use centimeters for this test.
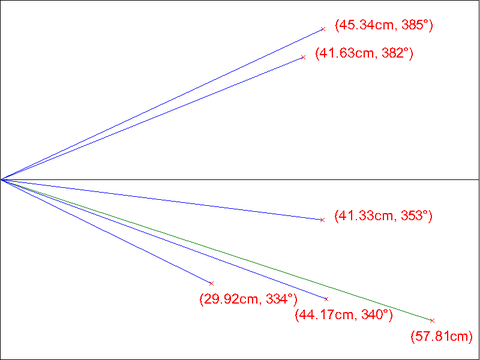
In this test, the robot will go forward a set distance in a specified time. Test the robot's accuracy and precision for this distance. Before testing begins, the standard must be found. To find the standard, program the robot to go forward for five seconds and measure the distance it travels. Divide the result by five, and then multiply by four. This number is the standard.
Once the standard has been obtained, the testing can begin.
Warning: Read the section on the Angle of Deviation Test before performing this test.
- Upload a program that will prompt the robot to travel for 4 seconds.
- Measure the distance traveled.
- Repeat this test five times.
Angle of Deviation Test
Note: This test is performed at the same time as the Distance Test. Since the robot is expected to travel in a straight line, the standard is 360°.
In this test, the robot will move forward for four seconds and the angle of deviation will be recorded. The angle of deviation is the angle between a straight line and a line drawn from the starting point to where the robot finishes.
- Use a protractor to draw a 0° line from the start point.
- Mark the start point and place the robot there. Identify a reference point on the robot.
- Run the Distance Test.
- Make a mark at the point where the robot finished, and draw a line from the start point to this mark.
- Measure the positive angle of deviation.
- Repeat this procedure five times.
Quality Improvement
- Assess the robot design from data collected and from observations.
- Make necessary adjustments.
- Retest the robot and collect data.
- Take pictures of both the original design and the modified design.
Reverse Engineering
- Visually assess the robot's design. Consider how it works.
- Sketch the front, top, and most detailed side of the robot. Be sure to include dimensions in the sketch.
- Also sketch the most detailed view of the gear train.
- Before disassembling the robot, ask the TA to take a picture of it.
- Disassemble the robot. Analyze its inner workings and sketch the gear train(s). Note: All sketches in EG1004 must be done in pencil.
- Have all sketches and original data signed by the TA.
With measurements for both tests performed and an analysis of the drive train of the robot, data analysis must begin. Calculate the average, accuracy, and precision for each test. Compare the results to the standard in order to determine if the robot is accurate and precise. Label all major components and describe their functions. Calculate percent accuracy and percent precision. Calculate the gear and velocity ratios.
- Examples
- If Ps was 5cm and Ap was 7cm, then the percent accuracy (%Acc) is 60%. This test does not pass the 80% criterion.
- If Ps was 5cm and Ap was 25cm, then the result of the percent accuracy equation is -300%. Since a negative percentage has no meaning in engineering, it can be said that the product has a percent accuracy of zero. Any percent accuracy less than zero is equal to zero.
- If Ps was 10cm and Ap was 8cm, then the percent accuracy is exactly 80%, which is a passing result.
- For the Distance Test, if the precision (P) was 0.5cm, the percent precision (%Prec) is 95.3%. This robot passes the 80% criterion for this test.
- For the Angle of Deviation Test, if the precision (P) was 10.25°, the percent precision ($Prec) is 71.8%. This robot does not pass the 80% criterion.
Tabulation of Results
To decide if the product is ready to manufacture, arrange the data in a table designed to calculate its precision and accuracy. Remember it must pass all the tests at a rate of at least 80%.
| Original Design | Accuracy | %Acc | Pass/Fail | Precision | %Prec | Pass/Fail |
|---|---|---|---|---|---|---|
| Distance Test | ||||||
| Angle of Deviation Test |
Retest with new design using the same table, record the data.
| New Design | Accuracy | %Acc | Pass/Fail | Precision | %Prec | Pass/Fail |
|---|---|---|---|---|---|---|
| Distance Test | ||||||
| Angle of Deviation Test |
The lab work is now complete. Please clean up the workstation. Return all unused materials to the TA. Refer to the Assignment section for the instructions needed to prepare the lab report.
Assignment
Individual Lab Report
Follow the lab report guidelines laid out in the page called Specifications for Writing Your Lab Reports in the Technical Communication section of this manual. The following discussion points should be addressed in the appropriate section of the lab report:
- Discuss product evaluation and the need for it.
- Discuss quality improvement and its importance.
- Explain why reverse engineering is important.
- Discuss a standard, an average, accuracy, and precision.
- Discuss the NXT kit and software used.
- Assess the techniques used in the testing process.
- Discuss better testing methods for the robot design.
- Describe how the components fit together and how the device was constructed.
- Describe and show how the gear and velocity ratios were calculated, and discuss their importance in the overall robot design as well.
- Analyze the original robot design and the final design then make a decision which design is better. Remember to substantiate the decision with the data, observations, and facts collected.
- Make a final evaluation of the product: should it go into production? Describe its accuracy and precision.
- Discuss the importance of %Prec and %Acc in determining product quality.
- Recommend if any design improvements should be made.
Remember: Lab notes must be taken. Experimental details are easily forgotten unless written down. EG1004 Lab Notes Paper can be downloaded and printed from the EG1004 Website. Use the lab notes to write the Procedure section of the lab report. At the end of each lab, a TA will scan the lab notes and upload them to the Lab Documents section of the EG1004 Website. One point of extra credit is awarded if the lab notes are attached at the end of the lab report. Keeping careful notes is an essential component of all scientific practice.
Team PowerPoint Presentation
Follow the presentation guidelines laid out in the page called EG1004 Lab Presentation Format in the Introduction to Technical Presentations section of this manual. When preparing the presentation, consider the following points:
- Based on the test results, what is the product's marketability?
- If determinations were negative, what improvements could be made?
- Why is product evaluation important?
- Discuss why quality improvement is important.
- Discuss the importance of gear and velocity ratios.
Footnotes
| ||||||||


