Investigating CO2 Production of Yeast
Objective
The experimental objective of this lab is to observe the effects of certain environmental conditions on the activity of microorganisms in a batch process. Activity will be determined by measuring production of carbon dioxide (CO2) by rehydrated yeast in each batch and qualitative observations of the turbidity and buoyancy of the batch mixture. Predictions will be made regarding the effects of variables within the batch mixture on the yeast’s activity, and then be evaluated for validity after the batches are observed.
Overview
The use of yeast or other biological agents, such as proteins or recombinant DNA, to form useful products is an example of biotechnology. A growing field, biotechnology has led to a number of important scientific milestones; for example, in 2020, the scientists who discovered CRISPR-Cas9, an enzyme that allows gene editing, won the Nobel Prize (Gostimskaya, 2022). Their work has allowed for innovations in fields such as healthcare and agriculture. This lab provides an elementary introduction to biotechnology by investigating the reactions of yeast, a microbial fungal species commonly used to convert substrate into valuable products, like bread and alcohol (Walther et al., 1995).
Cellular Respiration
Yeast is a species of single-celled fungus. Fungal cells, like plant and animal cells, are eukaryotic; they contain membrane bound organelles and genetic material stored within a nucleus. Cells must perform many different functions to survive, including the synthesis of proteins, the removal of waste products, and the regulation of internal conditions or homeostasis. These functions require energy obtained from the chemical energy stored within molecules consumed by the cell as food (also called substrate).
An important function is cellular respiration, which is the conversion of the substrate molecule to usable energy, a crucial portion of the cell’s metabolism. The basic reaction for cellular respiration is the conversion of the simple carbohydrate glucose (C6H12O6) into carbon dioxide and water by reacting it with oxygen, and in the process releasing its chemical energy used generate the cell’s energy storage molecule Adenosine Triphosphate (ATP) as see in equation (1).
In this lab, respiration will be monitored by measuring the amount of CO_2 produced from yeast and table sugar in warm water.
Batch Processes
In lab and industrial settings, cellular respiration often takes place in a reactor known as a batch reactor (Figure 1). In a batch reactor, reactants are mixed and heated in a sealed vessel. Variables such as temperature, time, and reactant concentrations can impact the rate of the reaction and the total amount of product produced.
In this experiment, a beaker will serve as the batch reactor, water will be the medium, and the substrate will be sugar. Four batch conditions will be investigated. In the first batch, a control experiment will provide a baseline measurement of the yeast behavior in warm water. In the second batch, table sugar will be introduced. In the third and fourth batches, the medium will be altered by adding vinegar or soap the solution.
It should be noted that in batch experiments, temperature should be optimized and held constant. Metabolism is dependent on temperature, as higher temperatures can increase the speed of chemical reactions within the cell. If temperatures become too high, the essential proteins within a cell begin to denature. In this exercise, temperature of the batches will be measured but not be controlled; in the time frame of the reaction, temperature should not change significantly to impact the results observed.
Measurements with Arduino Boards
The measurements made in this lab will be made by connecting sensors to a microcontroller called an Arduino. Microcontrollers are inexpensive, programmable computers that can perform simple functions. For example, microcontrollers perform specific functions in many household appliances, medical devices, cars, and other systems and devices.
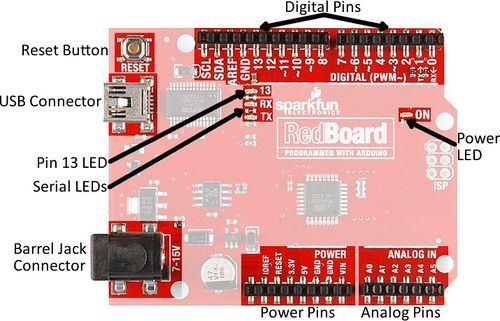
Arduino boards are commonly used for rapid prototyping projects. These boards come in many shapes and sizes, and some contain additional features, such as WiFi or Bluetooth connectivity. Different boards can also have different features, such as a higher processing speed and more memory. All Arduino boards have a general layout that is similar to that shown in Figure 2. Key parts are listed below; in this lab, the power pins, digital pins, and analog pins will be used.
- Reset Button: Restarts the board
- USB Connector: Provides power and connects it to the computer
- Pin 13 LED: Usable LED without making an LED circuit
- Serial LEDs: Shows if the Arduino is transmitting or receiving data from pins 0, 1, or the USB connection
The power pins are used to supply voltage to other pins, and are also used to ground pins.
- 3.3V: Usually used to power low-voltage sensors
- 5V: Used to power circuits
- GND: Ground pin, 0V
- VIN: Voltage-in can be used to power the board using a battery or other external voltage source
The digital and analog pins are used for input and output commands to the microcontroller and electrical components. They can be used with both analog and digital devices, as the Arduino board converts analog inputs to a digital input.
- A0-A5: Identical analog pins that can read sensors or control analog devices. Analog pins can read/write values from 0 to 1023
- Digital Pins 0-1: Transmitter and receiver pins. Do not use these pins for this lab
- Digital Pins 2-12: Digital pins that switch between HIGH states and LOW states. Can only read/write values HIGH or LOW, unlike analog pins that allow a greater range of values
- Digital Pin 13: Connected to the onboard LED, use it only as an input pin
The Arduino IDE
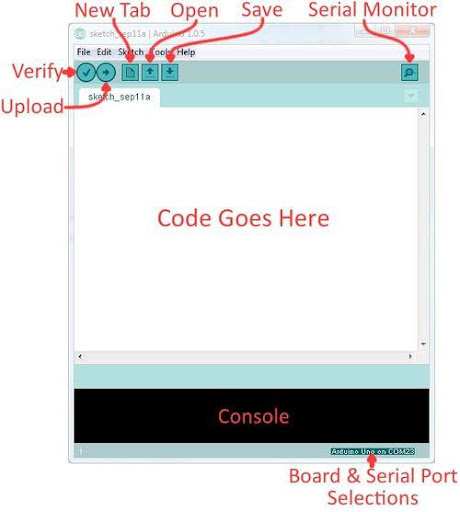
Arduino Integrated Development Environment (IDE) is a program that can be used to edit, compile, and upload code to a supported microcontroller. Figure 3 shows a screenshot of the program's interface.
- Verify: Checks code for errors and points those errors
- Upload: Verifies code and uploads it to the Arduino board
- Console: Shows errors found in the hardware
- Serial Monitor: Sends and receives messages to and from the board
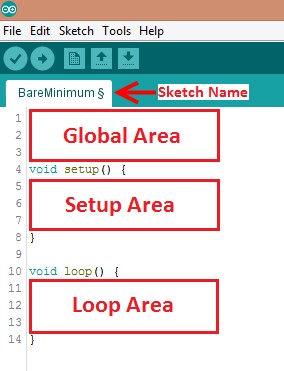
Programs written in Arduino IDE are called sketches. A basic sketch can be broken up into three different areas: global, setup, and loop. These areas are shown in Figure 4.
- Global: Contains constants and imported libraries
- Setup: Functions that run once at the start of the program. Setup functions often are used to activate pins and sensors in the program
- Loop: Function runs continuously after Setup function. Code in the Loop Area will continue to run until the Arduino loses power. Function often used in most of the program to read sensors and switch pins HIGH to LOW
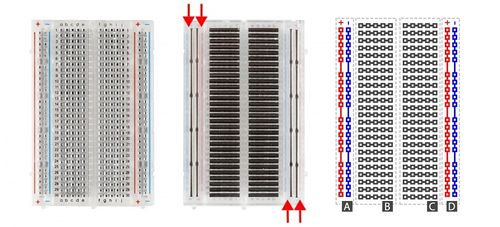
This lab will use a breadboard to connect sensors to the Arduino. Breadboards (Figure 5) are small boards that are commonly used for circuit prototyping. They allow the circuit’s components to be connected without making permanent connections. The red and blue stripes on the sides of the board (sections A and D) are called power rails and are connected down the board, usually used for powering and grounding. The non-colored rows between the power and ground strips (sections B and C) are connected across and are usually used for making the connections between components. Sections B and C are not connected to each other across the bridge in the middle of the board.
The breadboard used in this lab will be powered via connection to the Arduino. When the Arduino is powered, for example by plugging it into a PC, it can be used as a 5V voltage source.
Materials
The following materials will be used in this lab.
- 6.00g dry yeast
- 3 packets of table sugar
- 2.50 ml of white vinegar
- 2.50 ml of soap
- Warm water provided by TAs at 125˚F
- 1 gas sensor (MQ135 air quality sensor)
- 1 water temperature sensor (DS18B20 sensor with module)
- 1 Arduino UNO and USB cable
- 1 breadboard
- Plastic beakers
- 1 large beaker
- 4 weighing boats
- 2.50 ml plastic spoons
- 1.00 gal Ziploc bags
- Labeling tape and pens
- Digital scale
- Assorted wires
Procedure
Read this procedure thoroughly. There are many parts that can be accomplished at the same time by different group members. Do your best to effectively collaborate to complete the set-up as quickly as possible.
Part 1. Predictions
- Download the Student Observations Template and complete the “Before the Lab” section
- For each batch, create a hypothesis for your expected results. There are no right or wrong answers.
- Rank the batches from what you expect to be most active to least active.
- Have a TA check this document. Once they’ve approved it, proceed to Parts 2 and 5.
Part 2: Assembling the Circuit
- Assemble the measurement circuit.
- Create a common power and common ground rail using the 5V (red wire) and GND pins (black wire) on the Arduino.
- Power and Ground the DS18B20 water temperature sensor and MQ135 gas sensor (VCC pins in red are connected to the power rail, GND pins in black are connected to the ground rail).
- Attach the INPUT pins. The DS18B20 water uses digital input (DAT pin is connected to the digital data input). The MQ135 gas sensor uses analog inpput (A0 is connected to the analog data input). In the diagram below, they are in pins 7, and A0, respectively. It does not matter which pins are which as long as the pins match what is assigned to the code.
- Once every sensor is powered and grounded properly, allow a TA to check the completed circuit.
- Plug the Arduino into the monitor. The MQ135 gas sensor red indicator lights should light up.
- Select the COM port and upload the code. This will be the port that is not COM1.
- Download the Arduino Code and open it in the Arduino IDE.
- Note the assigned pins for the DS18B20 water and MQ135 gas sensors.
- In the Global Area, verify the temperature and humidity values. Take notice of whether the given values are in Fahrenheit or Celsius. If the values are not accurate with the current values, change the values to match the current values provided by the TAs.
- Compile the code by clicking on Verify then Upload buttons. If the <OneWire.h>, <DallasTemperature.h>, <time.h>, and <MQ135.h> libraries give errors, navigate to Tools → Manage Libraries and search for the libraries and install them (Figure 7). For each library, choose to install the first one that shows up under the search (Figure 8).
Part 3: Calibrating the MQ135 Gas Sensor
- Open the Serial Monitor on the Arduino IDE. Once the 2 minute warm-up period has elapsed, it will begin printing values from the sensor. The first column is the time stamp. There will be four different values: time, temperature, corrected Rzero and ppm (parts per million).
- To calibrate the MQ135 gas sensor, the Rzero value must be changed in the library.
- Open File Explorer, and navigate to Documents → Arduino → libraries → MQ135 → MQ135.h.
- Open the MQ135.h file using Notepad or any text editing software on the computer (Figure 9).
- In the .h file, change the ATMCO2 value (this value will be provided by a TA). Make sure to save and close the file (Figure 10).
- Once again, upload the code.
- Observe the corrected Rzero values for a few minutes. Once the value remains constant, copy the latest Rzero value.
- Open the MQ135.h file again and paste the Rzero value in its designated space. Save and close the file. Check that the rload value is 36.0 (Figure 11).
- Upload the code and verify if the CO2 readings are similar to the environment CO2 value provided by a TA. If the values are not similar, repeat steps 3 and 4.
- Upload your FINAL code to the Arduino. You will NOT be returning to Arduino and editing your code after this step.
- Close the Arduino window.
Part 4: Enabling the Data Streamer Add-in
- Download the Student Data Sheet as an Excel file and go to File > Options > Add-ins. Options is the last tab.
- Under Manage, select COM Add-ins click Go.
- Select 'Microsoft Data Streamer for Excel' add-in and then click OK. Other add-ins should be unselected.
- Click 'Connect a Device' under the Data Streamer > Data Sources and select 'Arduino Uno (COM#)'.
- Navigate to the 'Settings' tab at the bottom of the screen. Change parameters to the following:
- Data interval (ms) = 1000 ms (unchanged)
- Data rows = 600
- Data channels = 4
- Data orientation = 'Newest First'
- Return to the 'Data In' tab. Change the channel titles in the table from CH1, CH2, CH3, CH4, to 'Time (mins)', 'Temperature (F)', 'Corrected RZero', 'Corrected PPM' respectively.
Part 5: Sample Preparation
- Obtain 4 plastic beakers.
- Using the provided materials, prepare each batch mixture by adding the dry reactants into the beaker in Table 2. Do not add the yeast or water until instructed.
- Obtain 4 weighing boats for the 4 batches.
- Place the weighing boat on the mass balance. Tare the mass balance so the readout is 0.00 grams.
- With the provided dry yeast, measure out 1.5 grams.
- Repeat this process for all 4 weighing boats, so there are 4 samples of yeast, one for each batch.
| Batch | Condition | Composition |
|---|---|---|
| 1 | Control | None |
| 2 | Table Sugar | 1 packet table sugar |
| 3 | Acidic | 1 packet table sugar, 2.5 ml vinegar |
| 4 | Alkaline | 1 packet table sugar, 2.5 ml soap |
Part 6: Data Measurement
- Obtain the plastic bag.
- Make sure the beaker has the appropriate contents based on the Batch Table (Table 1).
- Add 100 mL of the warm water to each beaker. The warm water will be provided by a TA.
- Add the 1.5 grams of yeast that was measured previously to the beaker. Hold the beaker by its rim and gently swirl to wet the sample
- Rapidly place the batch in the plastic bag (Figure 12).
- Carefully place the DS180B20 water sensor such that the silver portion is submerged in the batch.
- Place the MQ135 gas sensor on top of the batch inside the plastic bag enclosure. Do not place it in the batch itself. Make sure the sensor does not fall into the mixture. This is a gas sensor.
- Seal the bag as tightly as possible. The seal will be pressed around the wires attached to the sensors (Figure 13).
- Ensure the plastic bag does not create a seal over the beaker.
- Ensure that the MQ135 gas sensor is not touching the batch.
- Go to the Excel and navigate to the 'Data In' tab. Make sure your device is still connected to Excel.
- Click 'Start Data' under Data Streamer > Data Streaming. Keep track of your starting time (actual time of day as you will need this later) and monitor 10 minutes in the 2nd column.
- The batch has to be in the enclosure for ten minutes. After the ten minutes elapse, click on Stop Data under Data Streaming.
- Copy the set of data from the Data Streamer Tab into the corresponding sheet for that batch in the Student Data Sheet.
- After ten minutes, open the bag and remove the batch and sensors from the enclosure.
- Leave the filled beaker on the table. Do not dump out any yeast until all the batches are completed.
- Air out the bag to remove any trapped CO2. (This can be done by turning the bag inside out and waving it vigorously).
- Wipe the DS180B20 water sensor that was in the batch so it is clear of yeast debris.
- Repeat steps 2-14 for each subsequent batch.
Part 7: Data Measurement
- Line up the completed batches. Note your qualitative observations of the buoyancy and turbidity of each sample.
- Within your raw data, plot the CO2 concentration over time for each batch. Also, plot the batch temperature over time.
- Calculate the average rate of CO2 production using the formula below (2).
- Using that information, revisit your initial hypotheses from part 1 in the Student Observations Template. Were they correct? Why or why not?
Part 8: Cleanup
- Dump out batches into the waste bucket provided by the TA rinse and wash beakers thoroughly.
- Disassemble circuit and clear station.
Assignment
Team Lab Report
Follow the lab report guidelines laid out in the EG1004 Writing Style Guide in the Technical Writing section of the manual. Respond to the bullet points below in the corresponding section of the lab report.
- Provide the graphs showing the accumulation of CO2 over time for each batch
- Show the sample calculations for the average CO2 production in parts per million per second for each batch
- Discuss any observations. Compare the predictions to the results
- Speculate on the variables may have affected the results. Relate these back to the scientific principles as introduced in the manual, and knowledge of biology and chemistry
- Based on the results, what variables appeared to have the greatest effect on each batch? If these results were used to design a batch reactor, which variables would control and why?
- Report on what was recorded in the Observations Template and the Data Sheet
Remember: Lab notes must be taken. Experimental details are easily forgotten unless written down. EG1004 Lab Notes paper can be downloaded and printed from the EG1004 Website. Use the lab notes to write the Procedure section of the lab report. At the end of each lab, a TA will scan the lab notes and upload them to the Lab Documents section of the EG1004 Website. One point of extra credit is awarded if the lab notes are attached at the end of the lab report. Keeping careful notes is an essential component of all scientific practice.
Team PowerPoint Presentation
Follow the presentation guidelines laid out in the EG1004 Lab Presentation Format in the Technical Presentations section of the manual. When preparing the presentation, consider the following points.
- Present the visuals and qualitative observations
- Present the graphs and quantitative results
- How is this experiment relevant to the field of biotechnology?
- Why is it important to observe microorganisms behavior in different environments?
References
Gostimskaya I. CRISPR-Cas9: A History of Its Discovery and Ethical Considerations of Its Use in Genome Editing. Biochemistry (Mosc). 2022 Aug;87(8):777-788. doi: 10.1134/S0006297922080090. PMID: 36171658; PMCID: PMC9377665.
I. Walther, B. Bechler, O. Müller, E. Hunzinger, A. Cogoli (1995) Cultivation of Saccharomyces cerevisiae in a bioreactor in microgravity. Journal of Biotechnology, Volume 47, Issues 2–3, Pages 113-127. https://doi.org/10.1016/0168-1656(96)01375-2.


