Making Good Looking Equations in PowerPoint Presentations
Making Good Looking Equations in PowerPoint Presentations
Technical professionals frequently have to include mathematical equations in their PowerPoint presentations. Unfortunately, in many cases the results are not very professional looking, with everything being different sizes and misaligned. In an effort to improve things, some presenters take screen shots of equations that do look good, and then paste it onto their slide, making a grainy image of what used to be a good looking equation with a background that doesn’t match the rest of the slide. We can do better.
It’s not hard to make an equation in PowerPoint that looks good and makes you look good. First, we’ll review how to put an equation into PowerPoint, and then how to make it look good.
Making the equation
First, we’ll review how to put an equation on a PowerPoint slide. First, bring up the slide that you want to have the equation and click on the text area to highlight it. Next, look at the menu at the top of the PowerPoint window and you’ll find an item called “Insert�?. Click it and a dropdown menu will appear. Click on “Object�? and a popup window will appear. If you don’t see the “Object�? item right away, keep the mouse on the menu and it will expand so you can see the item. After the popup window appears, make sure the “New Item�? radio button has been selected (it usually is by default), and in the middle of the window you’ll see a lengthy list of things you can include, in alphabetical order. Scroll down until you see “Microsoft Equation 3.0�? and double click it. Another popup window will appear that will contain the equation you make. At the top of the window there should be a toolbar of mathematical symbols you can use, as shown in Figure 1.
Figure 1: Windows Equation Editor Toolbar
If you don’t see the toolbar, you can make it visible to going to the menu at the top of the menu and clicking “View�?, and clicking on “Toolbar�? on the menu. This will put a check next to the item, and the toolbar appears at the top of the window.
As an example, we’ll make a variation of the equation that you made in Lab 1. In this case, we’ll have the phrase “root=�? and then the quadratic equation. Note the box in the Equation Editor window, and the flashing cursor. Like Word, this is where anything you type will appear.
In the text that follows, when we say to type something followed by text in quotes, you should omit the quotes. Start by typing “root=�?. Note that the text is relatively large script italics. Next, we want the fraction. Since you’ve already done this in Lab 1, we’ll summarize the instructions:
On the toolbar, look for the fraction symbol in the bottom row. Select the fraction symbol out of the dropdown menu. You get a fraction with two boxes, and the top box has the cursor. Type “-b�?. Then select the “±�? symbol in the top row of the toolbar. Next, select the square root symbol, which is in the same dropdown menu as the fraction. We need an exponential, so we select the exponential symbols from the dropdown menu next to the fraction dropdown menu. The exact item you want is the leftmost item in the fourth row. To help you select the proper item, we show the dropdown menu in Figure 2.
Figure 2: Exponential item dropdown menu
Some new boxes appear, and the cursor is where the exponential goes. Type the number “2�? and you have the proper power. Now press the cursor down key, or click on the main box, and the cursor will move down to where you type what will be squared. Type “b�?. We can now finish up what goes inside the square root by typing “-4ac�?. Next, we’ll do the bottom of the fraction. Click on the empty box at the bottom of the fraction and type “2a�?. You’ve now completed the formula.
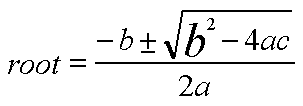
The formula is mathematically correct, but it doesn’t look very pretty. What you have should look like Figure 3.
Figure 3: The finished equation
There are multiple type sizes and styles. We’ll now clean them up so that the result looks professional. First, let’s see why things look different. Click on the word “root�?. The go up to the menu at the top of the window and click “Style�?. Note that it there is a check next to the word “Math�?. Click on the “Size�? item on the menu and you’ll see a check mark next to the word “Full�?. Now click on the “b�? that’s part of the b2 inside the square root. Once again, click on the “Style�? item in the menu and you’ll see that “Math�? is checked, but when you click on “Size�? you’ll see that “Symbol�? is checked instead of “Full�?. This is why this is a different size. We’ll now make this the same size as everything else so that it looks better. Double click the “b�? that’s the wrong size so that it’s highlighted. Now go up to the “Size�? menu item and click on the word “Full�?. The check mark moves from “Symbol�? to “Full�?, and the “b�? becomes the same size as everything else, making things look much better. The result is shown in Figure 4.
Figure 4: The improved equation
You can now use this technique any time you enter an equation to make it look good.
Some people don’t like the italicized script. You can change this too if you’d like. The style is what’s making the equation look this way. Let’s change the equation to a different style. First, select the entire equation by putting the mouse to the left of the equation, pressing the left mouse button, dragging the mouse across the entire equation, and releasing the mouse button. The entire equation will now be highlighted. Click on the “Style�? menu item and select “Text�? instead of “Math�?. Unfortunately, in changing the style, the sizes were set back to the default, and the “b�? is the wrong size again. Set the size back to “Full�? as described above to fix this. The equation now looks like Figure 5.
Figure 5: The equation in “Text�? style
If you want, you can try other styles, or define your own. However, the “Math�? style, once you fix the size issues, usually looks very good.
Putting the result on your PowerPoint slide
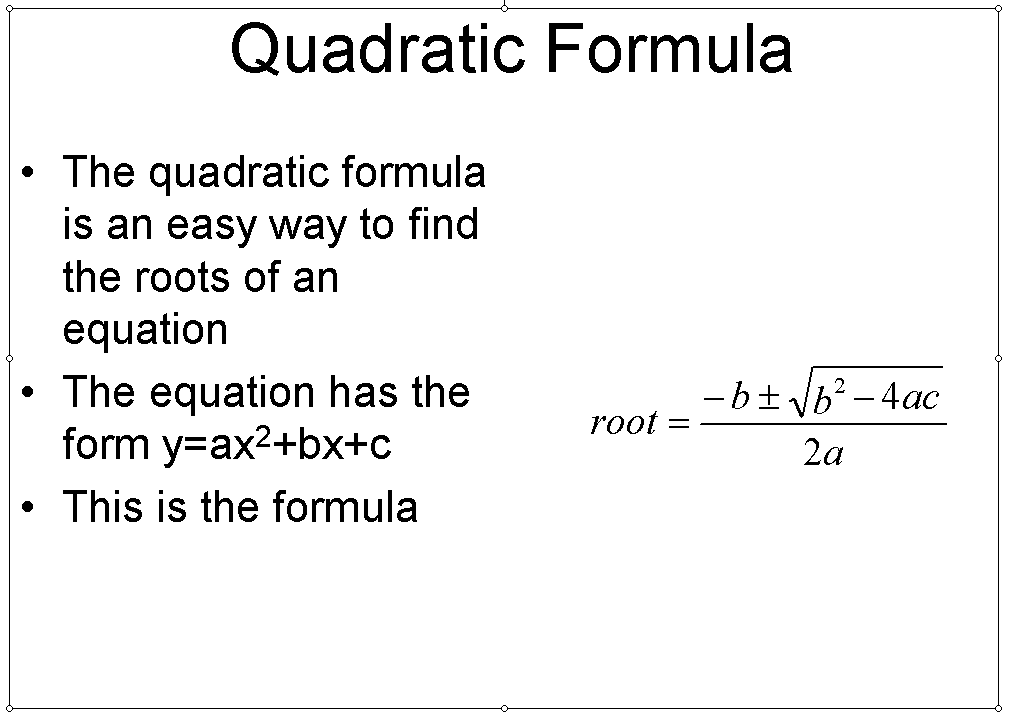
Now that you have an equation that looks good, we can now easily put it on the PowerPoint slide. Just close the Equation Editor by clicking on “File�? and “Exit and Return to Presentation�?, or just clicking on the “X�? of the window in the top right corner, like any other window. You’ll now return to your presentation with the equation on the slide, but probably not where you want it. Figure 6 shows a typical slide.
Figure 6: Typical slide with formula in the wrong place
We’ll now move the formula to the right place, and also resize it. The equation works just like any other image, so if you know how to work with images on slides you can skip the rest of this.
If you click on the equation a box of little circles will appear around and the cursor will turn into crosshairs with arrows on them. You can now drag the equation to where you want it. Just press the left mouse button, drag the mouse to where you want the equation, and release the button. You can also stretch and resize the equation if you want. If you “grab�? one of the corner circles by putting the mouse on it and pressing the left mouse button, you can make the equation bigger and smaller, releasing the mouse button when it’s the right size. You can also stretch the equation in just one direction by “grabbing�? a circle at the top or bottom, or one of the sides. We would advise against stretching the equation because it usually ends up with a result that looks weird
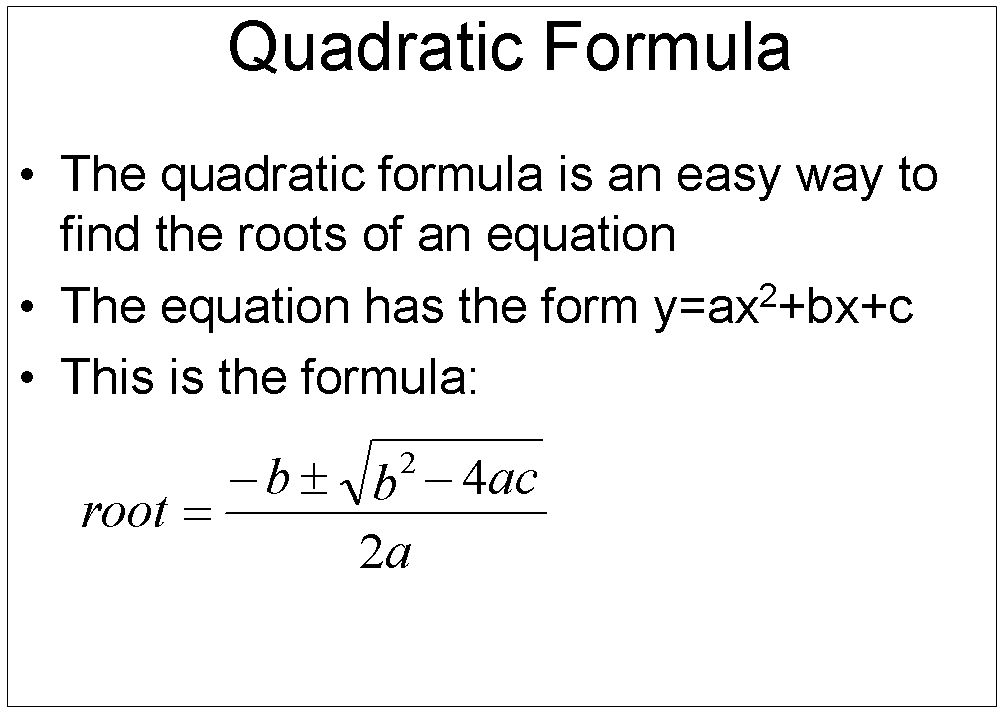
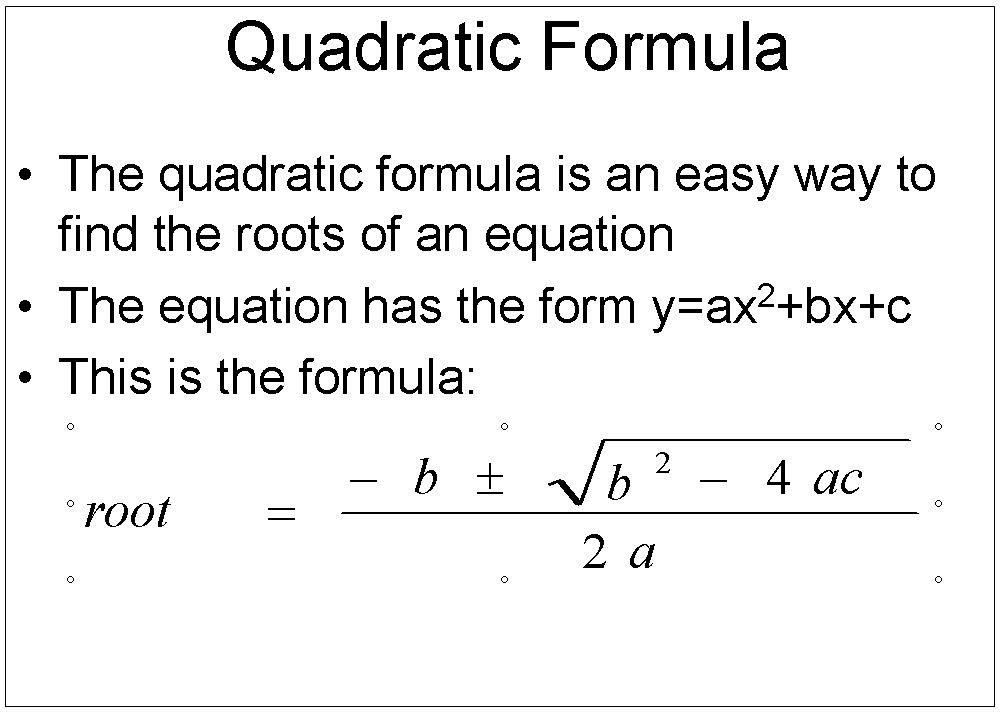
Figure 7 shows the final product where the equation has been moved and resized, and Figure 8 shows the same slide where the equation was stretched. As you can see, Figure 7 looks much better.
Figure 7: Finished slide
<
Figure 8: Finished slide with stretched equation
Summary
You now know how you can good looking slides with good looking equations on them. This will give you a competitive edge against others who don’t know how to do this. You’ll find that the same techniques can be used for many other types of objects, such as Excel spreadsheets, video files, and many others. If you want to review the full range of what you can include, go to back to the PowerPoint menu and select “Insert�? and “Object�? again. This time scroll through the list of types and you’ll see a rich selection. All of them work the same way, as we described here.


