Introduction to LabVIEW & Digital Logic (Virtual)
Objective
The objective of this lab is to use LabVIEW and digital logic to design a heating and cooling system and an alarm system, and to test both systems on a NI-ELVIS II+ prototyping board. Building these systems will demonstrate the potential for using simulated instruments in a laboratory. These programs will also obtain data from outside the computer and incorporate it into a program design. The lab will be divided into two parts. Both parts of the lab focus on creating a solution for the assigned problem statement.
Overview
LabVIEW
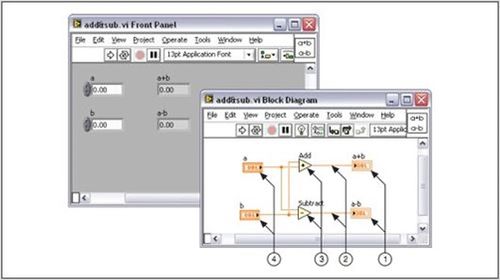
The Laboratory Virtual Instrument Engineering Workbench (LabVIEW) is a development environment designed by National Instruments that creates graphics-based programs called virtual instruments (VI) that simulate actual laboratory instruments. A VI consists of two parts: a front panel and a back panel (Figure 1). The front panel allows the user to interact with the VI by displaying outputs and allows the user to supply the program with inputs. The back panel consists of the code used by the VI to obtain inputs from the front panel, operates on the inputs, and displays the results.
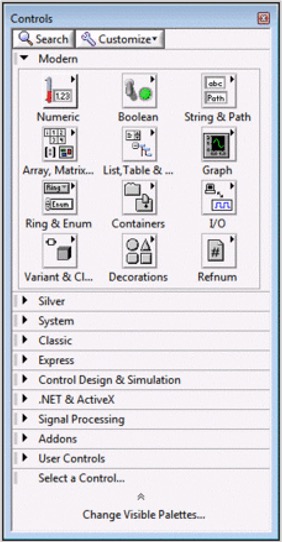
The front panel is built using controls and indicators. Controls are inputs that allow a user to supply information to the VI. Indicators are outputs that display the results based on the inputs given to the VI. Controls can be switches, knobs, dials, and buttons. Indicators can be meters, gauges, LEDs, and displays. These are located on the Controls palette and are placed on the front panel (Figure 2).
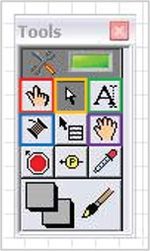
The back panel, which is also known as the block diagram, contains the graphics-based source code. The environment of the back panel is built using the Tools palette (Figure 3).
In Figure 3, only the icons in colored boxes will be used in this experiment. The operating tool changes the value of a control. The positioning tool positions, resizes, and selects objects. The labeling tool is used to create and edit all labels in the VI, such as the name of a Boolean control. The wiring tool wires objects together on the back panel. The scrolling tool allows scrolling the window by clicking and dragging.
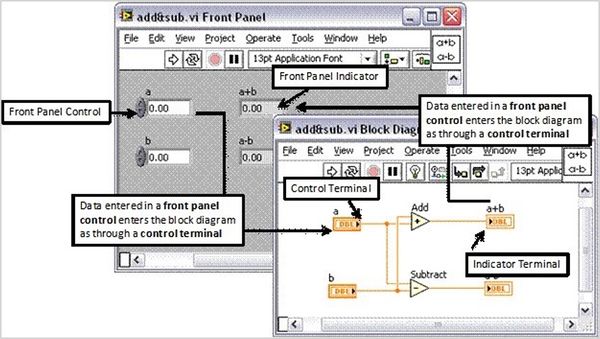
All of the objects placed on the front panel will appear on the back panel as terminals. Terminals are basically entry and exit ports. They exchange information between the front panel and block diagram and appear with small triangles in the icons to indicate that they can be used to process information (Figure 4). A control terminal has the triangle to the right to indicate that it sends data to be processed. An indicator terminal has the triangle to the left to indicate that it receives data.
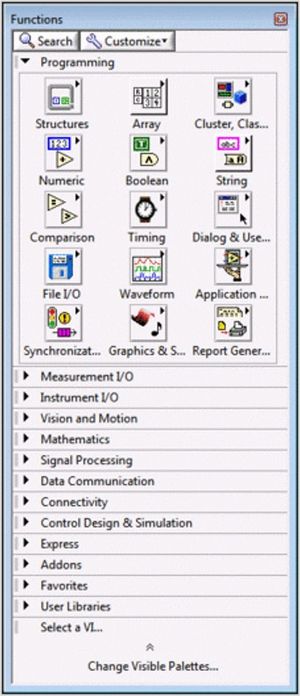
The back panel also contains structures and functions that perform operations on controls and supply data to indicators. Structures and functions are found on the Functions palette and are placed on the back panel (Figure 5).
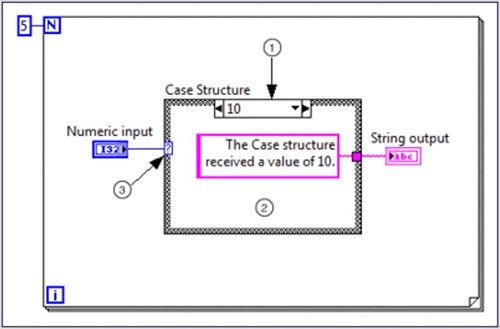
Structures are process control elements, such as while loops and for loops. The structure to be used in this experiment is the case structure (Figure 6), which is essentially multiple if-statements. A case structure contains multiple sub-diagrams (or cases), and a case will be executed depending on the input to the case structure.
In Figure 6, Item 1 is the selector label that displays the input value that the associated case will execute. The black arrows on the side of the selector label toggle between the different cases. Item 2 is the area for the code that executes the specific input in the selector label. When the selector label is toggled, the code in this area will also change. Item 3 is the case selector, which gives the input value to the case structure. The data type that is wired to the case selector that will determine the possible cases. For example, if a Boolean data type is wired to the case selector, the possible cases will only be true and false.
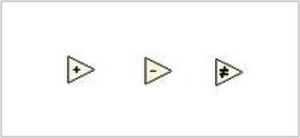
Functions are the fundamental operating elements of LabVIEW and have input and output terminals to pass data in and out. They are indicated by a pale yellow background in the icon (Figure 7).
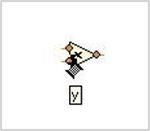
Functions have a certain number of inputs and outputs, depending on the type of function. For example, the addition function (leftmost icon in Figure 7) has two inputs as it will add the two inputs together, and it will have one output that is the sum of the inputs. The inputs are wired to the left side of the function, and the outputs are wired to the right side of the function. The number of inputs and outputs of a function can be observed by hovering over the icon with the wiring tool and observing the terminals that appear (Figure 8).
Collectively, controls, indicators, structures, and functions are referred to as nodes. Nodes are connected to one another using the wiring tool. For example, two controls and an indicator can be wired to the addition function so that the indicator displays the sum of the two controls (Figure 9). Notice how the two controls have the triangle on the right, and the indicator has the triangle on the left.
