Microsoft Project Skill Builder
EG1004 Skill Builder: Microsoft Project
OBJECTIVES
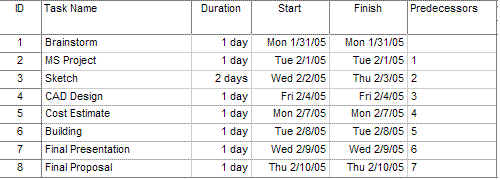
To create a Microsoft Project schedule for your independent project - by performing the instructions that follow and using Figure 1 as a sample.
Figure 1: A Typical Project Plan
Note that tasks are ordered chronologically and an estimate of the amount of time it takes to perform each task is specified.
YOUR ASSIGNMENT
MS Project Exercise (due at Recitation 4)
Your TA will show you how to use Microsoft Project to create the elements you will need to complete this assignment.
PROCEDURE
To Start on a New Project:
- Open Microsoft Project.
- Create a new file for your independent design project. To do this select Project, then Project Information. In the Schedule From field, choose Project Finish Date. Enter the date you expect to finish here. Click OK.
- Pull down the View menu, select View Bar, then click on the Gantt Chart icon to display the schedule layout screen.
- Add your tasks. To do this, move your cursor to the first box below Task Name. Type in the task name. Repeat this process for all the tasks needed for your project.
- There are two ways to set up relationships between the tasks. The first way is to select the first task, hold down CTRL and select the next task. Repeat this process until all the tasks you want to connect are highlighted. Then click the Link icon on your toolbar. An icon will appear in the Gantt Chart showing the relationship you designated. To begin to set up relationships the second way, you must first expand the size of the schedule layout screen by dragging the vertical bar on the right side of the screen to the right. When you can see the column called Predecessors, designate the relationship you want to create by typing the ID number of the task that will start in the box for the task that must finish first. An icon will appear in the Gantt Chart showing the relationship you designated. For example, if you would like Task 2 to begin upon completion of Task 1, type a 1 in the Task 2 box in the Predecessors column. Continue this process until you have established all the relationships you would like to exist among your tasks.
Note: Make sure that the current date is correct and that the calendar is set to standard.
Note:There are four relationships in Microsoft Project. They are Finish-to-Start, Start-to-Finish, Start-to-Start and Finish-to-Finish. Microsoft Project uses the Finish-to-Start relationship by default. To designate one of the other relationships, type SF, FF, or FS next ot the task ID in the predecessors box. For EG, we will use the Finish-to-Start relationship.
Note that you can change the relationship of the linked tasks. To do that, doubleclick on the connecting arrow. A window will appear labeled task dependency. Choose the relationship of you want for your tasks:
- Finish-to-Start - the first task must be finished until the second one can start.
- Start-to-Start - the tasks must start simultaneously.
- Finish-to-Finish - the tasks must finish together.
In the task dependency window, you can also choose the amount of lag time between tasks. If you do not designate lag time, Microsoft will begin Task 2 as soon as Task 1 is complete. If you need to include a break between tasks, you must instruct the program to do this.
To Change the Timescale:
Note: The Microsoft Project default setting for the Gantt Chart is a daily schedule. You will need to change this timescale for your independent project in order to show all data.
- Pull down the Format menu, select Timescale, or right-click on Date Display on the Gantt Chart and select Timescale.
- In the window that appears, under Middle Tier Formatting, set Units to Months.
- Select the Bottom Tier tab, under Minor Scale set Units to Weeks.
- Click OK.
To Set Task Duration:
In the Duration column highlight the box for the task you would like to adjust and enter the desired duration.
To designate a duration, use:
- hr for hours
- min for minutes
- wk for weeks
- mon for months
- edays for elapsed days
To Name Resources:
- Click on the Resource Sheet on the View Bar.
- Type in the names of the members of your team.
To Assign Resources:
In the Resources column of the Schedule Layout window, highlight the box in the row for the
task you would like to assign. Type in the name of the team member who will perform this task.
Tip: To assign a task to more than one person, type both names in the highlighted box, separated by a comma. By default, Microsoft Project will evenly distribute the task. To change this distribution, manually enter the percentages in the command line.
To Format the Gantt Chart
- From the Format menu select Gantt Chart Wizard. A window labeled Step 1 will appear, click Next.
- In the following window select Standard, and click Next.
- In the following window select Custom Task Information, and click Next.
- There are three fields in the window that appears:
- Under Left Field, select Name.
- Under Right Field, select Resource Names
- Under Inside Field select, %work complete.
- Click Next on the three screens that follow.
- Then click Format It.
- Exit the wizard.
Note: There are three Milestones and a Final Presentation in EG. This information should be included in your Gantt Chart. Placing the Milestones here will help keep your project on track. The directions for doing this appear here later.
Note: Once you become familiar with the program, you can modify and label your schedule to better fit your project.
To Add Subtasks:
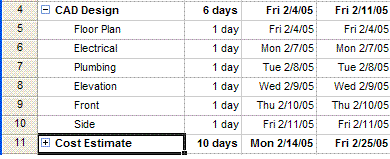
- In the Task Name field, select the tasks you would like to designate as subtasks and click the Indent button on the toolbar. To hide your subtasks, click on the – sign that appears in the box with the task. To make your subtasks reappear, click on the + sign.
Figure 2: Tasks and subtasks.
This completes your schedule. Be sure to save your work.
To Include Your Microsoft Project in Your PowerPoint Presentations:
- Select the camera icon.
- A window will appear. Under Render Image, select For Screen.
- Select Copy Selected Rows. Enter the start and finish date of your project.
- Go to Microsoft PowerPoint and paste (CTRL+V) the picture into your slide.
Note: This is step very important. Failure to do this causes more space than you need to be copied and your picture will be too large.
To Update Your Schedule:
- In the Tools menu go to Tracking and select Update Tasks.
- Enter the name of the task you want to update, whether it has been completed, its actual duration, or the time remaining. Then click OK.
Important: You should modify you project schedule each week.
To Update the Project:
- From the Tools menu select Tracking, then Update Project.
- Modify you schedule. Then click OK.
To Insert a New Task
- Select the point in your project where you would like the task to start.
- From the Insert menu select New Task.
Important: Be sure to update the task information to do this.
To Add Milestones:
- From the View menu select Gantt Chart.
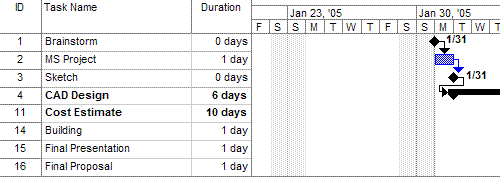
- Type 0 in the duration field of the task if you want to change. A diamond bullet will appear to indicate a milestone. See Figure 3.
figure 3: Milestones on Gantt Chart
To Add a Progress Line:
- From the View menu select Gantt Chart.
- From the Tools menu select Tracking, then Progress Lines.
- Click the Dates and Intervals tab.
Figure 4: Gantt Chart with Progress Line
Important: A graph on the Gantt Chart with peaks pointing to the left for work that is behind schedule and peaks pointing to the right for work that is ahead of schedule.
Project Float
The float of a project defines the amount of days that a project is early or late in meeting the final deadline. A float of +5 days (the progress line is to the right) means that the project will be completed 5 days ahead of schedule. A float of –5 days (the progress line is to the left) means that the project will be completed 5 days behind schedule. A float of 0 days means that a project will finish on the final date. A positive float is the result of tasks being completed ahead of anticipated finish dates. A negative float is the result of tasks taking longer to complete than originally scheduled.
For the independent projects, teams are to have a float of 0 days or better in order to complete the project by the final presentation day.
In any event, accurate MS Project schedules are to be presented in all progress reports. In the event that a team has a negative float at the time of a progress report, the MS Project Schedule with the negative float must be presented. To show the work-around, an adjusted MS Project Schedule must also be presented that results in a float of 0 days or better, along with the original schedule.
Your work is now complete. Please clean up your workstation.


