Difference between revisions of "Microphone Design Competition"
m (11 revisions) |
|||
| (10 intermediate revisions by the same user not shown) | |||
| Line 1: | Line 1: | ||
{{Outdated|lab|date=June 2004}} | |||
<h2>1 OBJECTIVES</h2> | <h2>1 OBJECTIVES</h2> | ||
| Line 34: | Line 34: | ||
small, varying current.</p> | small, varying current.</p> | ||
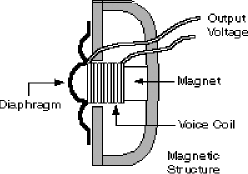
[[Image:Micfone_1.gif|frame|center|Figure 1: Dynamic Microphone Construction]] | |||
<p>In a <b><i>condenser microphone</i></b>, a static charge exists between the | <p>In a <b><i>condenser microphone</i></b>, a static charge exists between the | ||
| Line 55: | Line 54: | ||
piezoelectric strip to accomplish this<sup>2</sup></p> | piezoelectric strip to accomplish this<sup>2</sup></p> | ||
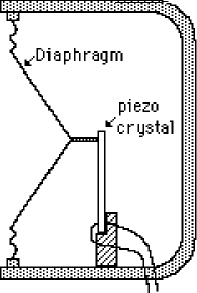
[[Image:Micfone_2.gif|frame|center|Figure 2: Piezoelectric Microphone Construction]] | |||
<p>You will be using LabVIEW's <b><i>TimeFreq</i></b> VI to test the quality of | <p>You will be using LabVIEW's <b><i>TimeFreq</i></b> VI to test the quality of | ||
| Line 70: | Line 68: | ||
more sound the microphone picked up. See Figure 3.</p> | more sound the microphone picked up. See Figure 3.</p> | ||
[[Image:Micfone_3.gif|frame|center|Figure 3: Oscilloscope plots: single frequency and noisy waveform]] | |||
<p>The second graph used to analyze your microphone is called a fast Fourier | <p>The second graph used to analyze your microphone is called a fast Fourier | ||
| Line 80: | Line 77: | ||
picking up unwanted background noise.</p> | picking up unwanted background noise.</p> | ||
[[Image:Micfone_4.gif|frame|center|Figure 4: FFT spectrum graphs: single frequency and noisy waveform]] | |||
<p>In designing your microphone, there are a few important factors you have to | <p>In designing your microphone, there are a few important factors you have to | ||
| Line 89: | Line 85: | ||
that all three of these conditions are satisfied.</p> | that all three of these conditions are satisfied.</p> | ||
[[Image:Micfone_5.jpg|frame|center|Figure 5: A dynamic microphone consisting of: A = diaphragm; B = coil; C = magnet; D = housing]] | |||
= coil; C = magnet; D = housing | |||
<h2>3 YOUR ASSIGNMENT</h2> | <h2>3 YOUR ASSIGNMENT</h2> | ||
| Line 189: | Line 182: | ||
to the amplified speaker as shown in Figure 6.</li> | to the amplified speaker as shown in Figure 6.</li> | ||
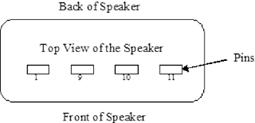
[[Image:Micfone_6.jpg|frame|center|Figure 6: Connections for the amplified speaker]] | |||
<li>Your TA will run the <b><i>TimeFreq</i></b> VI. The VI will look like | <li>Your TA will run the <b><i>TimeFreq</i></b> VI. The VI will look like | ||
Figure 7.</li> | Figure 7.</li> | ||
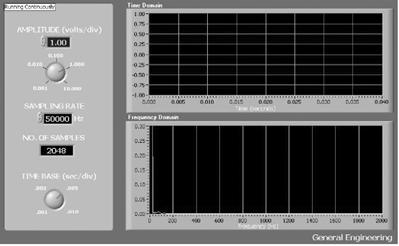
[[Image:Micfone_7.jpg|frame|center|Figure 7: <b><i>TimeFreq</i></b> VI]] | |||
<li>Your TA will press a key on the keyboard to generate a sound. Notice the | <li>Your TA will press a key on the keyboard to generate a sound. Notice the | ||
| Line 225: | Line 214: | ||
<p><sup>2</sup> How Stuff Works website. 2003. SHW Media Network. Retrieved | <p><sup>2</sup> How Stuff Works website. 2003. SHW Media Network. Retrieved | ||
July 28th, 2003. http://electronics.howstuffworks.com/question383.htm</p> | July 28th, 2003. http://electronics.howstuffworks.com/question383.htm</p> | ||
{{Outdated|lab|date=June 2004}} | |||
Latest revision as of 03:07, 11 July 2011
| This lab's accuracy may be compromised because of out-of-date information. The information displayed on this lab has been deprecated as of June 2004 and is kept for historical purposes only. There may or may not be information relevant to the current course curriculum. |
1 OBJECTIVES
The experimental objective of this lab is to determine what design will best capture sound using piezoelectric film. To do this, we will design and build a microphone out of simple household materials and piezoelectric film. You will then test the microphone's performance using LabVIEW. Your microphone will be entered in a competition against the other microphones in your section.
We will learn the properties of piezoelectric material and the characteristics of various microphones and how they function. We will also investigate LabVIEW's capacity as a testing device.
8.2 OVERVIEW
FYI Microphones are transducers that convert variations in air pressure caused by sound waves into electrical signals. The sound waves cause the air to vibrate; these vibrations are captured by a diaphragm. A diaphragm is a thin membrane that vibrates when hit by a forece, like a sound wave. The microphone then translates these vibrations into electrical current. How this happens depends upon the type of microphone being used.
Carbon microphones are very simple mechanisms. They were invented for use in the first telephones. The resistance of carbon dust is changed by variations in pressure caused by the movement of the diaphragm. This affects the electric curent flowing through the microphone.
Dynamic microphones use electromagnetism to generate an audio signal. A wire coil surrounding a magnet is attached to a diaphragm. Sound waves hitting the diaphragm cause it, along with the coil, to vibrate. Sound waves of different frequencies cause the diaphragm and coil to vibrate at different speeds. The movement of the coil within the magnetic field produces a small, varying current.
In a condenser microphone, a static charge exists between the diaphragm and the fixed back plate (this charge is supplied externally, usually by a battery). As the diaphragm vibrates, the distance between the fixed back plate and the diaphragm changes. This alters the capacitance of the diaphragm back plate capacitor. This fluctuating capacitance varies the electric current passing through the microphone, generating an audio signal.
In a ribbon microphone, a thin metal ribbon, acting as both diaphragm and coil, is suspended in a magnetic field. The ribbon vibrates in response to sound waves, generating a small, varying current.1
For this lab, we will be building a piezoelectric microphone. Certain crystalline materials exhibit piezoelectric behavior when pressure is applied to them. When you attach a diaphragm to a crystal, sound waves hitting the diaphragm will apply pressure to the crystal causing it to change shape (piezo in Greek means pressure). This action generates an electric current. Your team will be using a piezoelectric strip to accomplish this2
You will be using LabVIEW's TimeFreq VI to test the quality of your microphone. The VI simulates both an oscilloscope and a spectrum analyzer. An oscilloscope is a piece of test equipment used to plot electrical voltage vs. time, while a spectrum analyzer displays the frequency characteristics of an electric signal.
The TimeFreq VI uses two graphs to analyze the quality of your microphone. The first is a waveform graph. This graph plots voltage against time. Ideally, a signal composed of one frequency would have a graph that is smooth and continuous. The higher the amplitude of the graph, the more sound the microphone picked up. See Figure 3.
The second graph used to analyze your microphone is called a fast Fourier transform (FFT) frequency analysis graph (see Figure 4). It plots frequency against gain. An ideal FFT graph of a signal composed of one frequency would have one large peak. This graph would also be smooth. If your graph is not smooth your microphone is picking up the desired sound wave, but it is also picking up unwanted background noise.
In designing your microphone, there are a few important factors you have to consider. Your diaphragm must be light, rigid, and move freely when hit by sound waves. For our purposes, the piezoelectric strip is both the diaphragm and the crystal transducer. Therefore, you must evaluate ways to mount the strip so that all three of these conditions are satisfied.
3 YOUR ASSIGNMENT
PowerPoint Presentation and Team Lab Report (one report per team)
The following discussion points are to be addressed in the appropriate section of both your lab report and presentation:
- Describe the rules of the competition in your introduction. What consequences did the rules have on your design? You may do this in a numbered list. Full sentences please.
- Discuss the properties of piezoelectric film. Give examples of how it is used. You may have to do some research to answer this question.
- Describe your design and explain the choices you made. Make sure you include a discussion of the materials you chose and why.
- What is an FFT spectrum graph? What is an ideal FFT spectrum graph?
- If the graph of your microphone's performance was not ideal, how would you modify your design to get closer to the ideal?
4 MATERIALS AND EQUIPMENT
- Piezoelectric Film with Leads
- Amplified Speaker
- Cup (paper or plastic)
- Plastic Wrap
- Aluminum Foil
- Foam Chips
- Cellophane Tape
- Electronic Keyboard
- Lab PC with DAC Board and LabVIEW Program TimeFreq VI Installed
Remember: You are required to take notes. Experimental details are easily forgotten unless written down. You should keep a laboratory notebook for this purpose. Use your lab notes to write the Procedure section of your lab report. You must attach a copy of your lab notes to the WC copy of your lab report. Keeping careful notes is an essential component of all scientific practice.
5 COMPETITION RULES
The following rules must be observed at all times during the competition. Violation of any of these rules will result in the disqualification of your microphone.
- Microphone cannot be bigger than the largest cup provided.
- All materials must be placed inside the cup.
- You may only use the materials provided.
- The piezoelectric strip may not be bent.
- The cup may not be held or touched during the competition.
6 PROCEDURE
Microphone Design
Your TA will provide you with an electronic copy of a screenshot of the ideal waveform using LabVIEW's TimeFreq VI. Use this example when creating your microphone.
- Analyze your materials and consider your design options keeping in mind the lab's specifications. Make sure you take notes and make preliminary sketches during this process.
- sketch your design in pencil using the graph paper in your Design Portfolio. Label your drawings clearly. Have your TA sign the sketch.
- Build your microphone based on the sketch you just completed. Your TA will provide the materials needed for your design. If you decide to modify your design during the construction of your microphone, note the changes and describe the reasons for them.
- When you are satisfied with your design, ask your TA to take a picture of your microphone.
Competition
- Your TA has assembled the testing station your section will use in the competition. It consists of a PC with LabVIEW and the TimeFreq VI, an electronic keyboard, and an amplified speaker. Bring your design to the testing station.
- Place it on the keyboard and connect the leads from the piezoelectric film to the amplified speaker as shown in Figure 6.
- Your TA will run the TimeFreq VI. The VI will look like Figure 7.
- Your TA will press a key on the keyboard to generate a sound. Notice the waveform generated by your microphone. Stop the LabVIEW program when TimeFreq VI displays the best waveform. An electronic copy of a screenshot of your team's ideal waveform will be provided by your TA.
Note: If you are unhappy with your first trial, you may test your microphone up to two more times. Your last waveform will be the one used in the competition.
When testing is completed, all the waveforms produced will be analyzed. The one closest to the ideal waveform, provided at the beginning of the lab, will be the winner.
Your lab work is now complete. Please clean up your workstation. Return all unused materials to your TA. Refer to section 3: Your Assignment for the instructions you need to prepare your lab report.
Footnotes
1 How Stuff Works website. 2003. SHW Media Network. Retrieved July 28th, 2003. http://electronics.howstuffworks.com/question309.htm
2 How Stuff Works website. 2003. SHW Media Network. Retrieved July 28th, 2003. http://electronics.howstuffworks.com/question383.htm
| This lab's accuracy may be compromised because of out-of-date information. The information displayed on this lab has been deprecated as of June 2004 and is kept for historical purposes only. There may or may not be information relevant to the current course curriculum. |


