Difference between revisions of "Electronic Filters"
(1003 --> 1004) |
|||
| (25 intermediate revisions by 3 users not shown) | |||
| Line 1: | Line 1: | ||
= Objectives = | |||
The experimental objective of this lab is to build two electrical circuits and to test them using | |||
NI-ELVISmx instruments to identify each as a low-pass, high-pass, or band-pass filter. The -3dB point for each filter will also be identified. A simple radio that does not require a battery to operate will be built as an example of a band-pass filter. | |||
= Overview = | |||
electrical | It is important for electrical engineers to be able to selectively filter frequencies. An '''electronic filter''' works by allowing only designated frequencies to pass through. By tuning a radio to a particular station, it is isolating a specific frequency. The filter selects the station chosen by the listener from the hundreds of different stations that are broadcasting. | ||
To understand how filters work, it is important to understand the elements that make electrical filtering possible. Signals that occur naturally are composed of many frequencies. | |||
filters | |||
For example, the human voice is composed of frequencies ranging from 0–4kHz. A '''signal''' consists of a primary frequency, called a base frequency, and additional multiples of that frequency with different loudness called harmonics. Different devices will have different harmonics. This is why when a trumpet and clarinet both play the same musical note they sound different — their harmonics are different. The base frequency and the harmonics of these instruments are audible. | |||
Radio waves have a base frequency, and the audible information is contained in adjacent frequencies called sidebands. | |||
'''Voltage''', or electromotive force, and '''frequency''' are the building blocks of an electrical signal. Voltage is a force that propels electrons through a medium. '''Current''' is the amount of electric charge flowing past a specified circuit point per unit time. Frequency is the rate at which the signal repeats itself. | |||
The '''gain''' of a circuit is the ratio of its output power to its input. For devices that do not produce energy, such as the filters in this lab, the gain cannot be positive. Devices such as transistors and other amplifiers are needed to achieve positive gain. | |||
A filter is a circuit that shapes and controls the bandwidth of a signal; '''bandwidth''' is the range of frequencies that the filter allows to pass. For example, when the bass of an audio amplifier is turned up, that operates a filter that passes the low frequencies more than the high frequencies. Also, when a radio is tuned, it is using a filter that allows the base frequency and the sidebands of the desired station to pass, but not other stations. | |||
The filters that will be built in this lab are composed of '''resistors''' and '''capacitors'''. A resistor is designed to impede the flow of electricity and dissipate electrical energy in the form of heat. Resistors work by having the electricity flow through a poor conductor, such as carbon. The unit of resistance is the Ohm, named after George Ohm, and is represented by the Greek letter Omega (Ω). The voltage across a resistor obeys Ohm's Law: V = IR, where I is the current and R is the resistance. Varying the frequency of the voltage will not affect the voltage across the resistor. | |||
Capacitors are metal plates that are separated from each other, allowing electric charge to accumulate on the plates. These plates store energy rather than dissipate it, like a resistor. For DC voltage, provided by a device such as a battery, the plates will gather charge, and once the plates are charged, current will no longer pass so the capacitor looks like an open circuit, where nothing is connected. For high frequencies, the charge can quickly gather and dissipate off of the plates, allowing current to flow through the capacitor freely, making the capacitor behave like a short circuit. The unit of capacitance is the Farad, named after Michael Faraday, and is represented by the capital letter F. The relationship between the voltage across a capacitor and varying frequencies is shown in Figure 1. | |||
[[Image:lab_filters_1.gif|frame|center|Figure 1: Capacitor frequency response.]] | |||
'''Inductors''', also known as coils or chokes, are coils of wire that allow the current through a wire to form a magnetic field. Like capacitors, inductors store energy, but in the magnetic field instead of on plates; its behavior is the opposite of a capacitor. For DC voltage, the current will make a stable magnetic field and will flow freely, making the inductor behave like a short circuit. At high frequencies, the magnetic field does not have time to form before the current reverses and the field collapses, causing the inductor to resist the current flow, behaving like an open circuit. The unit of inductance is the Henry, named after Joseph Henry, and is represented by the capital letter H. The relationship between the voltage across an inductor and varying frequencies is shown in Figure 2. | |||
capacitors | |||
the | |||
voltage | |||
the current and | |||
[[Image:lab_filters_2.gif|frame|center|Figure 2: Inductor frequency response.]] | |||
The components of filters, such as resistors, capacitors, and inductors, are connected by conductors (wires) that carry electrons between these devices. The voltage is the same throughout the entire conductor, so the voltage across the two ends of the conductor is zero. | |||
How the components are connected is shown using a schematic diagram. Each component is represented by a symbol, and the connections between components are represented by lines. The symbols are designed to represent the physical characteristics of the components. A resistor is represented by a zigzag line showing how the electricity's path is impaired. A capacitor is shown as two parallel lines, representing its plates. An inductor is shown as a series of looping lines, representing the coils of wire. The schematic diagram symbols for these components are shown in Figure 3. | |||
[[Image:lab_filters_4.gif|frame|center|Figure 3: Component schematic symbols.]] | |||
Different combinations of resistors and capacitors allow engineers to build different kinds of filters to perform specific tasks. Resistors, inductors, and capacitors can be arranged in three different ways. In a series circuit, the circuit’s components are connected end to end. The current in a series circuit remains the same in all the electrical elements. In a series circuit, as shown in Figure 4, the sum of the voltages across each element is equal to the voltage of the power source (''V<sub>IN</sub> = V<sub>A</sub> + V<sub>B</sub> + V<sub>C</sub>''). | |||
[[Image:lab_filters_5.jpg|frame|center|Figure 4: A series circuit.]] | |||
In a parallel circuit, as shown in Figure 5, the components are connected at opposing ends. The current that is supplied by the voltage source equals the current that flows though elements D and E. The voltage across the elements that are parallel is the same (''V<sub>IN</sub> = V<sub>D</sub> = V<sub>E</sub>''). | |||
[[Image: | [[Image:lab_filters_6.jpg|frame|center|Figure 5: A parallel circuit.]] | ||
Series and parallel circuits can be combined in a hybrid circuit, as shown in Figure 6: | |||
circuit, as shown in Figure | |||
[[Image: | [[Image:lab_filters_25.jpg|frame|center|Figure 6: A hybrid circuit.]] | ||
The voltage across the top and bottom connectors is the same so (''V<sub>IN</sub> = V<sub>F</sub> = V<sub>G</sub> = (V<sub>H</sub> + V<sub>J</sub>'')). | |||
voltage | |||
(< | |||
To produce a graphical representation of the characteristic behavior of a circuit being analyzed, it is necessary to graph the gain of the circuit versus the frequency of the electrical signal. Gain is a measure of the power produced by the circuit, measured in decibels (dB), and is calculated using the formula in Equation 1. | |||
< | <math style="display: block; margin-left: auto; margin-right: auto;">Gain = 20\ log \left(\frac{V_{\text{OUT}}}{V_{\text{IN}}}\right)\,</math> | ||
Equation 1: Gain formula | |||
A '''3dB''' drop of signal power is the point at which the signal power is half of its original value. The frequency corresponding to this -3dB point is also the '''cutoff frequency''' of the filter. Note that since the filters built in this lab only contain passive components, the output voltage cannot be greater than the input voltage so the gain will never be a positive number because the logarithm of a number less than or equal to one is taken. | |||
In Equation 1, for the gain to be -3dB, ''V<sub>OUT</sub>'' must be ''V<sub>IN</sub>'' divided by <math style="height: 1.23em; vertical-align: baseline;">\sqrt{2}</math> = 1.414, or more easily written as ''V<sub>OUT</sub> = V<sub>IN</sub> / 1.414''. The -3dB point of a circuit is the frequency that causes the output voltage to be 0.707 times the input voltage. | |||
== Types of Filters == | |||
Once the electrical filters are built according to the specifications in this manual, the filter type must be identified. In this lab, there are three possibilities: low-pass, high-pass, or band-pass. | |||
Sometimes it is beneficial to remove the high frequency components from a signal because this is where unwanted noise frequently occurs. To do this, a '''low-pass filter''' is used. It passes the low frequencies while blocking the higher ones. The low-pass filter shown in Figure 7 has a gain that drops to -3dB at 1590 Hz, which is its -3dB point and corresponding cut-off frequency. The filter has a bandwidth of 0Hz to 1590Hz and it only allows frequencies from 0Hz to 1590Hz to pass through. Figure 7 shows the characteristic behavior of a low-pass filter. A trend line showing the response of the filter is also shown. Note that for low frequencies, the gain is 0dB, meaning that the output equals the input. The filter suppresses high frequencies, as shown by the trend line on the right. | |||
[[Image:lab_filters_8.gif|frame|center|Figure 7: Characteristic behavior of a low-pass filter.]] | |||
A '''high-pass filter''' passes the high frequencies, but blocks the low ones, the opposite response of a low-pass filter. The -3dB point for the high-pass filter shown in Figure 8 is 160Hz. This is determined using the same method used for the low-pass filter. Figure 8 shows the characteristic behavior of a high-pass filter as well as the trend line and its cutoff frequency. This filter has a bandwidth of 160Hz to infinity and that the filter only allows frequencies greater than 160Hz to pass through. | |||
of | |||
the | |||
[[Image:lab_filters_11.gif|frame|center|Figure 8: Characteristic behavior of a high-pass filter.]] | |||
A '''band-pass filter''' allows a certain range of frequencies to pass through and blocks all other frequencies. The frequency of the highest response point is called the resonant frequency and for an ideal filter will be 0dB. This type of filter has two -3dB points, one above the resonant frequency and one below it, and so two cutoff frequencies. The difference in these two cutoff frequencies is the bandwidth of the band-pass filter. Figure 9 shows the characteristic behavior of a band-pass filter. | |||
[[Image:lab_filters_12.gif|frame|center|Figure 9: Characteristic behavior of a band-pass filter.]] | |||
The band-pass filter shown in Figure 9 has a resonant frequency of approximately 500Hz and -3dB points with cutoff frequencies of approximately 400Hz and 600Hz. The bandwidth of this filter is approximately 600Hz to 400Hz, or 200Hz. | |||
A notch filter rejects a specific range of frequencies and passes the others, the opposite of a band-pass filter. Notch filters are frequently used to remove interference from a signal, but will not be used in this lab. | |||
The filters here are ideal filters and show total power transfer of 0dB at their maximum response. Real filters frequently show some losses and may have a maximum response less than 0dB. The -3dB point is still defined according to the formula shown in Equation 1. | |||
A '''breadboard''' will be used in this lab. Breadboards have horizontal and vertical connectors. The front of the breadboard is shown in Figure 10a. The back of the breadboard, with its protective cover removed showing the internal connections, is shown in Figure 10b. | |||
[[Image: | [[Image:lab_filters_14a.jpg|frame|center|Figure 10a: Front of breadboard with red squares indicating where connections are broken, | ||
making two independent halves.]] | |||
[[Image:lab_filters_14b.jpg|frame|center|Figure 10b: Back of breadboard with red squares indicating where connections are broken, | |||
making two independent halves.]] | |||
To identify resistor types, look at the colored bands. Hold the resistor horizontally with the three bands that are close together to the left, as shown in Figure 11. The first two colors determine the first two digits of the resistance, and the third band determines how many zeroes to add. Each colored band represents a particular number. | |||
[[image:lab_filters_16.gif|frame|center|Figure 11: Color-coded bands on a 1kΩ resistor.]] | |||
< | {| class="wikitable" | ||
|+Resistor color code: | |||
!Color!!First Band!!Second Band!!Third Band | |||
|- | |||
|Black||style="text-align: center;"|0||style="text-align: center;"|0||× 1 | |||
|- | |||
|Brown||style="text-align: center;"|1||style="text-align: center;"|1||× 10 | |||
|- | |||
|Red||style="text-align: center;"|2||style="text-align: center;"|2||× 100 | |||
|- | |||
|Orange||style="text-align: center;"|3||style="text-align: center;"|3||× 1000 | |||
|- | |||
|Yellow||style="text-align: center;"|4||style="text-align: center;"|4||× 10000 | |||
|- | |||
|Green||style="text-align: center;"|5||style="text-align: center;"|5||× 100000 | |||
|- | |||
|Blue||style="text-align: center;"|6||style="text-align: center;"|6||× 10<sup>6</sup> | |||
|- | |||
|Violet||style="text-align: center;"|7||style="text-align: center;"|7||× 10<sup>7</sup> | |||
|- | |||
|Gray||style="text-align: center;"|8||style="text-align: center;"|8||× 10<sup>8</sup> | |||
|- | |||
|White||style="text-align: center;"|9||style="text-align: center;"|9||× 10<sup>9</sup> | |||
|} | |||
The fourth band indicates the tolerance of the resistor, which means how close its actual resistance will be to the value indicated by the bands: | |||
{| class="wikitable" | |||
!Color!!Tolerance | |||
|- | |||
|Gold||style="text-align: center;"|5% | |||
|- | |||
|Silver||style="text-align: center;"|10% | |||
|- | |||
|No band||style="text-align: center;"|20% | |||
|} | |||
As an example, a 470kΩ resistor with a 5% tolerance would have color bands of yellow, violet, yellow, and gold. | |||
For capacitors, the capacitance is stamped on the capacitor (Figure 12), especially if the capacitor is large. Most capacitors have very small values. For small capacitors, the most common units are microfarads (μF), nanofarads (nF), and picofarads (pF). The following conversion table shows how these units relate to each other: | |||
< | 1 μF=10<sup>3</sup>nF=10<sup>6</sup>pF<br \> | ||
1 nF=10<sup>3</sup>pF | |||
Sometimes the value is coded. The following rules are commonly used in marking values on capacitors: | |||
* If there are only two digits on the capacitor, the value is in pF | |||
* For three digits, the first two digits of the number are the value of the capacitor, and the third is a power of 10, with the units in pF. For example, a capacitor with a value of 103 would be 10*10<sup>3</sup> pF, or 0.01 nF. To make this a little easier, Table 3 might be helpful. | |||
*: | |||
{| class="wikitable" style="margin-left: 1.5em;" | |||
!CODE /<br />Marking!!µF<br />microfarads!!nF<br />nanofarads!!pF<br />picofarads | |||
|- | |||
|100||0.00001||0.01||10 | |||
|- | |||
|101||0.0001||0.1||100 | |||
|- | |||
|102||0.001||1||1,000 | |||
|- | |||
|103||0.01||10||10,000 | |||
|- | |||
|104||0.1||100||100,000 | |||
|- | |||
|105||1||1,000||10<sup>6</sup> | |||
|- | |||
|106||10||10,000||10<sup>7</sup> | |||
|- | |||
|107||100||100,000||10<sup>8</sup> | |||
|} | |||
Finally, capacitors might use a series of colored bands, like resistors, with exactly the same meaning, except the units are in pF instead of ohms. | |||
Also, where there are digits on the capacitor, there might be a letter following the digits. This indicates the tolerance of the capacitor according to Table 4. | |||
{| class="wikitable" | |||
!Letter Code!!Tolerance | |||
|- | |||
|C||±0.25pF | |||
|- | |||
|D||±0.5pF | |||
|- | |||
|F||1% | |||
|- | |||
|G||2% | |||
|- | |||
|J||5% | |||
|- | |||
|K||10% | |||
|- | |||
|M||20% | |||
|- | |||
|Z||-20%/+80% | |||
|} | |||
Figures 12 and 13 show two capacitors. Use the data in Tables 3 and 4 to verify their values. | |||
< | <div><div style="float: left; display: inline;">[[Image:Lab_filters_27.jpg|frame|none|Figure 12: 0.001 µF capacitors.]]</div><div style="float: left; display: inline; width: 10%;"> </div><div style="float: left; display: inline;">[[Image:Lab_filters_28.jpg|frame|none|Figure 13: 0.01 µF capacitors.<br />(Top capacitor rated at 20% tolerance.]]</div></div><br clear="both" /> | ||
< | |||
< | |||
</ | |||
For inductors, the value is stamped on the inductor. | |||
= Materials and Equipment = | |||
* Two 100kΩ resistors | |||
* A 1MΩ resistor | |||
* A 0.001μF capacitor | |||
* An NI-ELVIS II+ with prototyping board | |||
* Coaxial cables with alligator clips on one end | |||
* A 1N34 diode | |||
* High impedance headphone | |||
* A 10pF capacitor | |||
* A 1mH inductor | |||
* Wiring | |||
<p>1 &# | = Procedure = | ||
1 | == Circuit Testing == | ||
# Plug in the NI-ELVIS II+ prototyping board and connect the USB cable to the lab PC. | |||
# [[Image:Lab_filters_15.png|thumb|right|250px|Figure 14: New data acquisition device pop-up window.]]Power on the NI-ELVIS II+ by toggling the switch on the back of the device. When the pop-up window appears, select NI-ELVISmx Instrument Launcher and click OK (Figure 14). <br style="clear: both;" /> | |||
# Select FGEN (the function generator) in the Instrument Launcher window (Figure 15). | |||
#: [[Image:Lab_filters_18.png|thumb|center|640px|Figure 15: NI ELVISmx Instrument Launcher window.]] | |||
# [[Image:Lab_filters_19.png|thumb|right|640px|Figure 16: NI ELVISmx Function Generator window.]] Set the frequency to 1000 Hz in the Function Generator window (Figure 16). The frequency 1000 can be typed in the box as an alternative. Set the amplitude to 2 V<sub>p-p</sub> (Volts peak-to-peak) and set the signal route to FGEN BNC. Make sure that the sine wave is selected on the left.<br style="clear: both;" /> | |||
# Select Scope (the oscilloscope) in the Instrument Launcher window (Figure 15). | |||
# Connect one coaxial cable to FGEN and another one to CH 0 on the NI-ELVIS II+ (located at the upper left corner of the device). | |||
# Clip the red and black alligator clips together. | |||
# Click run in the Function Generator and Oscilloscope windows. | |||
# Make sure the oscilloscope on the lab PC looks similar to Figure 17. If the wave appears as if it is horizontally compressed, change the Timebase setting until the waveform looks similar to that in Figure 17. | |||
#: [[Image:Lab_filters_17.png|thumb|center|640px|Figure 17: Oscilloscope window.]] | |||
# Record the ''V<sub>p-p</sub>'' reading. This is the ''V<sub>IN</sub>''. When finished calibrating the function generator and the oscilloscope, the ''V<sub>p-p</sub>'' reading on the lab PC will be approximately 2.000V. Use this figure for all computations. Calculate 0.707*''V<sub>IN</sub>'' and write it down. This is the voltage at the -3dB point that is used to find the cutoff frequency. | |||
# Build Circuit 1. Stop the function generator. <span style="color: red;">'''DO NOT''' close the program! Doing so will result in losing the settings that were configured.</span> Use the schematic diagram in Figure 16 to build the circuit. | |||
#: [[Image:lab_filters_20.jpg|frame|center|Figure 18: Circuit 1 (R = 100kΩ, C = 0.001μF).]] | |||
# Insert one end of a 100kΩ resistor into the breadboard at B3 and the other end at G3. | |||
# Insert one end of a 0.001μF capacitor into the breadboard at H3 and the other end at H10. | |||
# Attach the red alligator clip from the CH 0 cable to the top lead of the capacitor (i.e., the one connected with the resistor). Connect the black alligator clip to the bottom lead of the capacitor (i.e., the one not connected to the resistor). | |||
# Affix the red alligator clip from the FGEN cable to left end of the resistor (i.e., the one not connected to the capacitor). Connect the black alligator clip to the bottom lead of the capacitor (i.e., the one not connected to the resistor and that also has an alligator clip connected to it from the CH 0 cable). | |||
# Run the function generator. Change the frequency on the function generator in this pattern (10, 20, 50, 100, 200, 500, 1000, 2000, 5000, 10000 Hz) and record the ''V<sub>p-p</sub>'' reading at each frequency for 10 measurements. Observe the voltages above and below the -3dB point. Find the -3dB point exactly by starting with the frequency just below the -3dB point, and then increasing the frequency until the voltage corresponding to the -3dB point is found. Note the frequency and write it down. This is the cutoff frequency. If the frequency reading on the oscilloscope is a question mark, or the ''V<sub>p-p</sub>'' reading fluctuates significantly, adjust the Scale Volts/Div and/or the Time/Div setting until the frequency reading gives a number. | |||
# Stop the function generator and disconnect all the wires, capacitors, and resistors from the breadboard. Use the schematic diagram in Figure 19 to build Circuit 2. | |||
#: [[Image:lab_filters_22.gif|frame|center|Figure 19: Circuit 2 (R = 1 MΩ, C = 0.001μF).]] | |||
# Connect the red alligator clip from the CH 0 cable to the top lead of the resistor (i.e., the one connected with the capacitor). Connect the black alligator clip to the bottom lead of the resistor (i.e., the one not connected to the capacitor). | |||
# Attach the red alligator clip from the FGEN cable to left end of the capacitor (i.e., the one not connected to the resistor). Connect the black alligator clip to the bottom lead of the resistor (i.e., the one not connected to the capacitor and that also has an alligator clip connected to it from the CH 0 cable). If the circuit is wired successfully, the oscilloscope will have a horizontal line across the center of the screen. | |||
# Run the function generator. Change the frequency on the function generator in this pattern (10, 20, 50, 100, 200, 500, 1000, 2000, 5000, 10000Hz) and record the ''V<sub>p-p</sub>'' reading at each frequency for a total of 10 measurements. Observe the voltages above and below the -3dB point. Find the -3dB point exactly by starting with the frequency just below the -3dB point voltage. Now find the -3dB point exactly by starting with the frequency just below the -3dB point, and then increasing the frequency until the voltage corresponding to the -3dB point is found. Note the frequency and write it down. This is the cutoff frequency. | |||
# Stop the function generator and disconnect the all the wires, capacitors, and resistors from the breadboard. | |||
#: There are several items on the circuit diagram Figure 20 that may be unfamiliar. The item in the top left corner that looks like a rake is an antenna and will be connected after the circuit is completed. The item in the bottom left corner that has three horizontal lines is an earth ground, which will also be connected later. The component in the top middle that looks like an arrow going into a line is a diode. A diode will be a component in Circuit 3. | |||
#: Circuit 3 is a crystal set radio (Figure 20). It is a working radio that does not require a battery. It got its name because originally a galena crystal was used instead of the 1N34 diode shown in the circuit diagram. The band-pass filter is the inductor and capacitor shown on the left side of the circuit diagram. Since this design emphasizes quick assembly using a breadboard, the radio can only get one or two stations. More refined designs can the found on the World Wide Web via a search on the term crystal set. A more detailed description of how the radio works is outside the scope of this lab, but a brief version is given in the Appendix. | |||
#: [[Image:lab_filters_25.gif|frame|center|Figure 20: Circuit 3 (Crystal Set Radio).]] | |||
#: '''Note:''' To avoid confusion, only use the left half of the breadboard (i.e., the columns marked A through J). | |||
# Insert one end of the 1N34 (or 1N34A) diode into the breadboard at J55 and the other end into the breadboard at J60. | |||
#: '''Note:''' The orientation of the diode is not critical to the operation of the radio - it can be put in the circuit in either orientation. | |||
# Insert one end of the 10pF capacitor into the breadboard at H60. | |||
# Insert the other end of the capacitor into any of the pins on the column to the left of column A. | |||
# Insert the 1mH inductor into the breadboard vertically in the same row as the diode and capacitor. | |||
# Insert the second lead of the inductor vertically in any pin in the same column as the other end of the capacitor. | |||
#: '''Note:''' There should be three wires in one row of the breadboard. The antenna will be connected here later, so remember this column. Similarly, the other ends of the inductor and capacitor should be in the same row. The ground wire and one of the headphone wires will be connected later, so remember this row. | |||
# Insert one end of the 100kΩ resistor in the same row as the other end of the diode. | |||
# Insert the other end of the resistor into the same column as the ends of the inductor and capacitor. | |||
# Connect one wire from the headphone to the same row as one end of the diode and resistor. | |||
# Connect the other headphone wire to the column that has the ends of the inductor, capacitor, and resistor. | |||
# Connect the antenna located at the front of the lab into the same column as the inductor and the diode. | |||
# Listen for music. In the lab report and presentation, indicate quality and loudness of the music heard from the crystal set. | |||
# After completing the radio, disconnect it from the antenna and ground, and return to the lab to put away the equipment and clean up the work area. | |||
< | == Data Analysis == | ||
{| class="wikitable" style="float: right;" | |||
|+ style="caption-side: bottom;" | Table 5: Sample data table. | |||
!Frequency (Hz)!!V<sub>IN</sub> (Volts)!!V<sub>OUT</sub> (Volts)!!Gain=20log(V<sub>OUT</sub>/V<sub>IN</sub>) (dB) | |||
|- | |||
|10||2.0|||| | |||
|- | |||
|20||2.0|||| | |||
|- | |||
|50||2.0|||| | |||
|- | |||
|100||2.0|||| | |||
|- | |||
|200||2.0|||| | |||
|- | |||
|500||2.0|||| | |||
|- | |||
|1000||2.0|||| | |||
|- | |||
|2000||2.0|||| | |||
|- | |||
|5000||2.0|||| | |||
|- | |||
|10000||2.0|||| | |||
|} | |||
# Create two tables in Microsoft Excel (one each for the low-pass filter and high-pass filter) to record the data. Remember the ''V<sub>IN</sub>'' is a constant. Each table should look like Table 5. | |||
Instruct Microsoft Excel to calculate the gain using Equation. | |||
# Plot two Gain (Y) vs. Frequency (X) graphs using the Scatter (X, Y) template. Make one graph for each table. | |||
#: Find the template on the Insert tab, under the Charts collection, with the Scatter icon. Click on the arrow below or next to the icon and select the top left icon in the pulldown gallery. Get the desired axes by double-clicking on the axis. Additional chart elements, such as labels and titles, can be added by clicking on the chart, which will add a design tab to the ribbon. In the Chart Styles collection, click the icon that looks like the desired graph. Rightclick on the items to be changed. | |||
# Change the x-axis to logarithmic scale. | |||
#: Right click on the x-axis and click on Format Axis. Depending on the version, either a dialog window or a sidebar will appear. Look for Logarithmic scale. Click the check box next to this item and click Close. | |||
# Identify each of the circuits as a low-pass or high-pass filter. Find the -3dB point and the cutoff frequency.<br style="clear: both;" /> | |||
The lab work is now complete. Please clean up the workstation. Return all unused materials to a TA. Refer to the '''''[[#Assignment|Assignment]]''''' section for the instructions needed to prepare the lab report. | |||
= Assignment = | |||
the | == Individual Lab Report == | ||
Follow the lab report guidelines laid out in the page called Specifications for Writing Lab Reports in the Technical Communication section of this manual. The following points should be addressed in the appropriate section of the lab report: | |||
* What is an oscilloscope? Some research may be required to answer this question | |||
* Discuss the different types of electrical elements. (i.e. resistor, capacitor, inductor) | |||
* Observe the graphs generated from each circuit. What type of filter does each circuit produce? | |||
* Does each circuit produce the expected result? If not, explain why | |||
* Locate the -3dB point and cutoff frequency on each graph to determine the bandwidth of each filter | |||
* What is the -3dB point used for? | |||
* Name the three different types of filters and applications for each | |||
* Discuss any problems encountered; was the experiment a success or a failure? If a failure, why? | |||
* Describe the operation/circuitry of the crystal set | |||
* How does environmental noise affect radios and how could filters be used to help? | |||
* How could the low-pass and high-pass filters be changed and used together to make a band-pass filter? | |||
{{Lab notes}} | |||
== Team PowerPoint Presentation == | |||
Follow the presentation guidelines laid out in the page called [[EG1004 Lab Presentation Format]] in the ''Introduction to Technical Presentations'' section of this manual.When preparing the presentation, consider the following points: | |||
* How do the results obtained validate the function of the filters created? | |||
* What are some applications of electronic filters? | |||
* Why is the -3dB point important? What is its significance? How is it determined? | |||
= Appendix: How a Crystal Set Works = | |||
'''Note:''' This material has information about how a crystal set works. This section is not required reading. | |||
== History == | |||
Some of the earliest radios made were crystal sets. They have a number of advantages: | |||
# They do not require a power source, such as a battery, so they can be used any time. This makes them very valuable during blackouts and recovery from disasters | |||
# They have so few components they can be built quickly, usually out easily obtained parts | |||
# They are rugged because of their simplicity, so they can be used while traveling | |||
# Unlike regular radios, they do not emit a signal, making them excellent stealth radios. This is important to people who must listen to the radio without giving away their position | |||
The radio has several major components: | |||
# An antenna, which should be as long as possible — the longer the antenna, the more stations heard | |||
# An earth ground. As the name implies, this connects the radio to the earth, allowing signals it receives to return to ground to complete the circuit | |||
# A band-pass filter consisting of an inductor and a capacitor. Usually the values of one or both these components can be changed, or varied. For the inductor, if it can be varied, it is by turning a rod going through the middle of the inductor. For the capacitor, if it can be varied, the capacitor plates are visible and can be rotated. Changing these values allows the frequency to be changed, tuning the radio | |||
# A diode is shown in the middle of the circuit diagram. The signal from the band-pass filter would look like a sine function (similar to the low-pass and high-pass filters), but instead of its amplitude being constant, it would change substantially. A typical signal is shown in Figure 21. | |||
#: [[Image:lab_filters_24.gif|frame|center|Figure 21: Received signal waveform.]] | |||
#: The variation in the waveform is the desired audio signal (sound) to be heard. This is called amplitude modulation, or AM, for short. | |||
#: A diode is a device that passes electrical current in one direction. There are many other materials that can be used as a diode. During World War II, many soldiers used a rusty razor blade as a diode. After the invention of semiconductors, diodes are now made of silicon or germanium. For a crystal set, germanium is a better choice. In electronics in the United States, diodes have names that start with 1N, followed by a number and possibly a letter. The number is a serial number assigned by agreement among the electronics manufacturers. A letter, if present, indicates an improved version of the product. The diode used here is 1N34, but the improved 1N34A could be used as well. Transistors always start with the designation of 2N. | |||
#: The diode is used as a detector, which detects the sound from the radio wave. It does this by removing the negative part of the sine wave, leaving only positive voltages. The headphones act as a low-pass filter, seeing only the height of the sine wave rather than the voltage variations of the sine wave itself. This amplitude is the audible audio signal. | |||
# The headphone makes the signal audible. Sometimes a resistor is put in parallel with the headphone to boost the signal. | |||
The negative thing about crystal sets is that they are essentially a craft item. Sometimes they do not work for any apparent reason. Sometimes they work in ways that are not totally understood. | |||
{{Laboratory Experiments}} | |||
Latest revision as of 02:34, 31 August 2022
Objectives
The experimental objective of this lab is to build two electrical circuits and to test them using NI-ELVISmx instruments to identify each as a low-pass, high-pass, or band-pass filter. The -3dB point for each filter will also be identified. A simple radio that does not require a battery to operate will be built as an example of a band-pass filter.
Overview
It is important for electrical engineers to be able to selectively filter frequencies. An electronic filter works by allowing only designated frequencies to pass through. By tuning a radio to a particular station, it is isolating a specific frequency. The filter selects the station chosen by the listener from the hundreds of different stations that are broadcasting.
To understand how filters work, it is important to understand the elements that make electrical filtering possible. Signals that occur naturally are composed of many frequencies.
For example, the human voice is composed of frequencies ranging from 0–4kHz. A signal consists of a primary frequency, called a base frequency, and additional multiples of that frequency with different loudness called harmonics. Different devices will have different harmonics. This is why when a trumpet and clarinet both play the same musical note they sound different — their harmonics are different. The base frequency and the harmonics of these instruments are audible.
Radio waves have a base frequency, and the audible information is contained in adjacent frequencies called sidebands.
Voltage, or electromotive force, and frequency are the building blocks of an electrical signal. Voltage is a force that propels electrons through a medium. Current is the amount of electric charge flowing past a specified circuit point per unit time. Frequency is the rate at which the signal repeats itself. The gain of a circuit is the ratio of its output power to its input. For devices that do not produce energy, such as the filters in this lab, the gain cannot be positive. Devices such as transistors and other amplifiers are needed to achieve positive gain.
A filter is a circuit that shapes and controls the bandwidth of a signal; bandwidth is the range of frequencies that the filter allows to pass. For example, when the bass of an audio amplifier is turned up, that operates a filter that passes the low frequencies more than the high frequencies. Also, when a radio is tuned, it is using a filter that allows the base frequency and the sidebands of the desired station to pass, but not other stations.
The filters that will be built in this lab are composed of resistors and capacitors. A resistor is designed to impede the flow of electricity and dissipate electrical energy in the form of heat. Resistors work by having the electricity flow through a poor conductor, such as carbon. The unit of resistance is the Ohm, named after George Ohm, and is represented by the Greek letter Omega (Ω). The voltage across a resistor obeys Ohm's Law: V = IR, where I is the current and R is the resistance. Varying the frequency of the voltage will not affect the voltage across the resistor.
Capacitors are metal plates that are separated from each other, allowing electric charge to accumulate on the plates. These plates store energy rather than dissipate it, like a resistor. For DC voltage, provided by a device such as a battery, the plates will gather charge, and once the plates are charged, current will no longer pass so the capacitor looks like an open circuit, where nothing is connected. For high frequencies, the charge can quickly gather and dissipate off of the plates, allowing current to flow through the capacitor freely, making the capacitor behave like a short circuit. The unit of capacitance is the Farad, named after Michael Faraday, and is represented by the capital letter F. The relationship between the voltage across a capacitor and varying frequencies is shown in Figure 1.

Inductors, also known as coils or chokes, are coils of wire that allow the current through a wire to form a magnetic field. Like capacitors, inductors store energy, but in the magnetic field instead of on plates; its behavior is the opposite of a capacitor. For DC voltage, the current will make a stable magnetic field and will flow freely, making the inductor behave like a short circuit. At high frequencies, the magnetic field does not have time to form before the current reverses and the field collapses, causing the inductor to resist the current flow, behaving like an open circuit. The unit of inductance is the Henry, named after Joseph Henry, and is represented by the capital letter H. The relationship between the voltage across an inductor and varying frequencies is shown in Figure 2.

The components of filters, such as resistors, capacitors, and inductors, are connected by conductors (wires) that carry electrons between these devices. The voltage is the same throughout the entire conductor, so the voltage across the two ends of the conductor is zero.
How the components are connected is shown using a schematic diagram. Each component is represented by a symbol, and the connections between components are represented by lines. The symbols are designed to represent the physical characteristics of the components. A resistor is represented by a zigzag line showing how the electricity's path is impaired. A capacitor is shown as two parallel lines, representing its plates. An inductor is shown as a series of looping lines, representing the coils of wire. The schematic diagram symbols for these components are shown in Figure 3.

Different combinations of resistors and capacitors allow engineers to build different kinds of filters to perform specific tasks. Resistors, inductors, and capacitors can be arranged in three different ways. In a series circuit, the circuit’s components are connected end to end. The current in a series circuit remains the same in all the electrical elements. In a series circuit, as shown in Figure 4, the sum of the voltages across each element is equal to the voltage of the power source (VIN = VA + VB + VC).

In a parallel circuit, as shown in Figure 5, the components are connected at opposing ends. The current that is supplied by the voltage source equals the current that flows though elements D and E. The voltage across the elements that are parallel is the same (VIN = VD = VE).

Series and parallel circuits can be combined in a hybrid circuit, as shown in Figure 6:

The voltage across the top and bottom connectors is the same so (VIN = VF = VG = (VH + VJ)).
To produce a graphical representation of the characteristic behavior of a circuit being analyzed, it is necessary to graph the gain of the circuit versus the frequency of the electrical signal. Gain is a measure of the power produced by the circuit, measured in decibels (dB), and is calculated using the formula in Equation 1.
Equation 1: Gain formula
 Equation 1: Gain formula
A 3dB drop of signal power is the point at which the signal power is half of its original value. The frequency corresponding to this -3dB point is also the cutoff frequency of the filter. Note that since the filters built in this lab only contain passive components, the output voltage cannot be greater than the input voltage so the gain will never be a positive number because the logarithm of a number less than or equal to one is taken.
In Equation 1, for the gain to be -3dB, VOUT must be VIN divided by = 1.414, or more easily written as VOUT = VIN / 1.414. The -3dB point of a circuit is the frequency that causes the output voltage to be 0.707 times the input voltage.
 = 1.414, or more easily written as VOUT = VIN / 1.414. The -3dB point of a circuit is the frequency that causes the output voltage to be 0.707 times the input voltage.
Types of Filters
Once the electrical filters are built according to the specifications in this manual, the filter type must be identified. In this lab, there are three possibilities: low-pass, high-pass, or band-pass.
Sometimes it is beneficial to remove the high frequency components from a signal because this is where unwanted noise frequently occurs. To do this, a low-pass filter is used. It passes the low frequencies while blocking the higher ones. The low-pass filter shown in Figure 7 has a gain that drops to -3dB at 1590 Hz, which is its -3dB point and corresponding cut-off frequency. The filter has a bandwidth of 0Hz to 1590Hz and it only allows frequencies from 0Hz to 1590Hz to pass through. Figure 7 shows the characteristic behavior of a low-pass filter. A trend line showing the response of the filter is also shown. Note that for low frequencies, the gain is 0dB, meaning that the output equals the input. The filter suppresses high frequencies, as shown by the trend line on the right.

A high-pass filter passes the high frequencies, but blocks the low ones, the opposite response of a low-pass filter. The -3dB point for the high-pass filter shown in Figure 8 is 160Hz. This is determined using the same method used for the low-pass filter. Figure 8 shows the characteristic behavior of a high-pass filter as well as the trend line and its cutoff frequency. This filter has a bandwidth of 160Hz to infinity and that the filter only allows frequencies greater than 160Hz to pass through.

A band-pass filter allows a certain range of frequencies to pass through and blocks all other frequencies. The frequency of the highest response point is called the resonant frequency and for an ideal filter will be 0dB. This type of filter has two -3dB points, one above the resonant frequency and one below it, and so two cutoff frequencies. The difference in these two cutoff frequencies is the bandwidth of the band-pass filter. Figure 9 shows the characteristic behavior of a band-pass filter.

The band-pass filter shown in Figure 9 has a resonant frequency of approximately 500Hz and -3dB points with cutoff frequencies of approximately 400Hz and 600Hz. The bandwidth of this filter is approximately 600Hz to 400Hz, or 200Hz.
A notch filter rejects a specific range of frequencies and passes the others, the opposite of a band-pass filter. Notch filters are frequently used to remove interference from a signal, but will not be used in this lab.
The filters here are ideal filters and show total power transfer of 0dB at their maximum response. Real filters frequently show some losses and may have a maximum response less than 0dB. The -3dB point is still defined according to the formula shown in Equation 1.
A breadboard will be used in this lab. Breadboards have horizontal and vertical connectors. The front of the breadboard is shown in Figure 10a. The back of the breadboard, with its protective cover removed showing the internal connections, is shown in Figure 10b.


To identify resistor types, look at the colored bands. Hold the resistor horizontally with the three bands that are close together to the left, as shown in Figure 11. The first two colors determine the first two digits of the resistance, and the third band determines how many zeroes to add. Each colored band represents a particular number.

| Color | First Band | Second Band | Third Band |
|---|---|---|---|
| Black | 0 | 0 | × 1 |
| Brown | 1 | 1 | × 10 |
| Red | 2 | 2 | × 100 |
| Orange | 3 | 3 | × 1000 |
| Yellow | 4 | 4 | × 10000 |
| Green | 5 | 5 | × 100000 |
| Blue | 6 | 6 | × 106 |
| Violet | 7 | 7 | × 107 |
| Gray | 8 | 8 | × 108 |
| White | 9 | 9 | × 109 |
The fourth band indicates the tolerance of the resistor, which means how close its actual resistance will be to the value indicated by the bands:
| Color | Tolerance |
|---|---|
| Gold | 5% |
| Silver | 10% |
| No band | 20% |
As an example, a 470kΩ resistor with a 5% tolerance would have color bands of yellow, violet, yellow, and gold.
For capacitors, the capacitance is stamped on the capacitor (Figure 12), especially if the capacitor is large. Most capacitors have very small values. For small capacitors, the most common units are microfarads (μF), nanofarads (nF), and picofarads (pF). The following conversion table shows how these units relate to each other:
1 μF=103nF=106pF
1 nF=103pF
Sometimes the value is coded. The following rules are commonly used in marking values on capacitors:
- If there are only two digits on the capacitor, the value is in pF
- For three digits, the first two digits of the number are the value of the capacitor, and the third is a power of 10, with the units in pF. For example, a capacitor with a value of 103 would be 10*103 pF, or 0.01 nF. To make this a little easier, Table 3 might be helpful.
| CODE / Marking |
µF microfarads |
nF nanofarads |
pF picofarads |
|---|---|---|---|
| 100 | 0.00001 | 0.01 | 10 |
| 101 | 0.0001 | 0.1 | 100 |
| 102 | 0.001 | 1 | 1,000 |
| 103 | 0.01 | 10 | 10,000 |
| 104 | 0.1 | 100 | 100,000 |
| 105 | 1 | 1,000 | 106 |
| 106 | 10 | 10,000 | 107 |
| 107 | 100 | 100,000 | 108 |
Finally, capacitors might use a series of colored bands, like resistors, with exactly the same meaning, except the units are in pF instead of ohms.
Also, where there are digits on the capacitor, there might be a letter following the digits. This indicates the tolerance of the capacitor according to Table 4.
| Letter Code | Tolerance |
|---|---|
| C | ±0.25pF |
| D | ±0.5pF |
| F | 1% |
| G | 2% |
| J | 5% |
| K | 10% |
| M | 20% |
| Z | -20%/+80% |
Figures 12 and 13 show two capacitors. Use the data in Tables 3 and 4 to verify their values.


(Top capacitor rated at 20% tolerance.
For inductors, the value is stamped on the inductor.
Materials and Equipment
- Two 100kΩ resistors
- A 1MΩ resistor
- A 0.001μF capacitor
- An NI-ELVIS II+ with prototyping board
- Coaxial cables with alligator clips on one end
- A 1N34 diode
- High impedance headphone
- A 10pF capacitor
- A 1mH inductor
- Wiring
Procedure
Circuit Testing
- Plug in the NI-ELVIS II+ prototyping board and connect the USB cable to the lab PC.
- Power on the NI-ELVIS II+ by toggling the switch on the back of the device. When the pop-up window appears, select NI-ELVISmx Instrument Launcher and click OK (Figure 14).
- Select FGEN (the function generator) in the Instrument Launcher window (Figure 15).
- Set the frequency to 1000 Hz in the Function Generator window (Figure 16). The frequency 1000 can be typed in the box as an alternative. Set the amplitude to 2 Vp-p (Volts peak-to-peak) and set the signal route to FGEN BNC. Make sure that the sine wave is selected on the left.
- Select Scope (the oscilloscope) in the Instrument Launcher window (Figure 15).
- Connect one coaxial cable to FGEN and another one to CH 0 on the NI-ELVIS II+ (located at the upper left corner of the device).
- Clip the red and black alligator clips together.
- Click run in the Function Generator and Oscilloscope windows.
- Make sure the oscilloscope on the lab PC looks similar to Figure 17. If the wave appears as if it is horizontally compressed, change the Timebase setting until the waveform looks similar to that in Figure 17.
- Record the Vp-p reading. This is the VIN. When finished calibrating the function generator and the oscilloscope, the Vp-p reading on the lab PC will be approximately 2.000V. Use this figure for all computations. Calculate 0.707*VIN and write it down. This is the voltage at the -3dB point that is used to find the cutoff frequency.
- Build Circuit 1. Stop the function generator. DO NOT close the program! Doing so will result in losing the settings that were configured. Use the schematic diagram in Figure 16 to build the circuit.
 Figure 18: Circuit 1 (R = 100kΩ, C = 0.001μF).
- Insert one end of a 100kΩ resistor into the breadboard at B3 and the other end at G3.
- Insert one end of a 0.001μF capacitor into the breadboard at H3 and the other end at H10.
- Attach the red alligator clip from the CH 0 cable to the top lead of the capacitor (i.e., the one connected with the resistor). Connect the black alligator clip to the bottom lead of the capacitor (i.e., the one not connected to the resistor).
- Affix the red alligator clip from the FGEN cable to left end of the resistor (i.e., the one not connected to the capacitor). Connect the black alligator clip to the bottom lead of the capacitor (i.e., the one not connected to the resistor and that also has an alligator clip connected to it from the CH 0 cable).
- Run the function generator. Change the frequency on the function generator in this pattern (10, 20, 50, 100, 200, 500, 1000, 2000, 5000, 10000 Hz) and record the Vp-p reading at each frequency for 10 measurements. Observe the voltages above and below the -3dB point. Find the -3dB point exactly by starting with the frequency just below the -3dB point, and then increasing the frequency until the voltage corresponding to the -3dB point is found. Note the frequency and write it down. This is the cutoff frequency. If the frequency reading on the oscilloscope is a question mark, or the Vp-p reading fluctuates significantly, adjust the Scale Volts/Div and/or the Time/Div setting until the frequency reading gives a number.
- Stop the function generator and disconnect all the wires, capacitors, and resistors from the breadboard. Use the schematic diagram in Figure 19 to build Circuit 2.
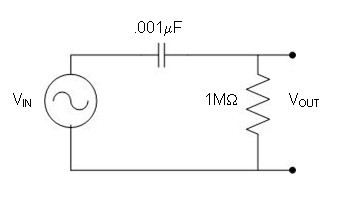 Figure 19: Circuit 2 (R = 1 MΩ, C = 0.001μF).
- Connect the red alligator clip from the CH 0 cable to the top lead of the resistor (i.e., the one connected with the capacitor). Connect the black alligator clip to the bottom lead of the resistor (i.e., the one not connected to the capacitor).
- Attach the red alligator clip from the FGEN cable to left end of the capacitor (i.e., the one not connected to the resistor). Connect the black alligator clip to the bottom lead of the resistor (i.e., the one not connected to the capacitor and that also has an alligator clip connected to it from the CH 0 cable). If the circuit is wired successfully, the oscilloscope will have a horizontal line across the center of the screen.
- Run the function generator. Change the frequency on the function generator in this pattern (10, 20, 50, 100, 200, 500, 1000, 2000, 5000, 10000Hz) and record the Vp-p reading at each frequency for a total of 10 measurements. Observe the voltages above and below the -3dB point. Find the -3dB point exactly by starting with the frequency just below the -3dB point voltage. Now find the -3dB point exactly by starting with the frequency just below the -3dB point, and then increasing the frequency until the voltage corresponding to the -3dB point is found. Note the frequency and write it down. This is the cutoff frequency.
- Stop the function generator and disconnect the all the wires, capacitors, and resistors from the breadboard.
- There are several items on the circuit diagram Figure 20 that may be unfamiliar. The item in the top left corner that looks like a rake is an antenna and will be connected after the circuit is completed. The item in the bottom left corner that has three horizontal lines is an earth ground, which will also be connected later. The component in the top middle that looks like an arrow going into a line is a diode. A diode will be a component in Circuit 3.
- Circuit 3 is a crystal set radio (Figure 20). It is a working radio that does not require a battery. It got its name because originally a galena crystal was used instead of the 1N34 diode shown in the circuit diagram. The band-pass filter is the inductor and capacitor shown on the left side of the circuit diagram. Since this design emphasizes quick assembly using a breadboard, the radio can only get one or two stations. More refined designs can the found on the World Wide Web via a search on the term crystal set. A more detailed description of how the radio works is outside the scope of this lab, but a brief version is given in the Appendix.
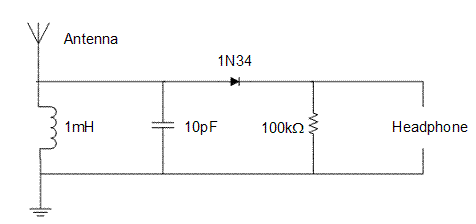 Figure 20: Circuit 3 (Crystal Set Radio).
- Note: To avoid confusion, only use the left half of the breadboard (i.e., the columns marked A through J).
- Insert one end of the 1N34 (or 1N34A) diode into the breadboard at J55 and the other end into the breadboard at J60.
- Note: The orientation of the diode is not critical to the operation of the radio - it can be put in the circuit in either orientation.
- Insert one end of the 10pF capacitor into the breadboard at H60.
- Insert the other end of the capacitor into any of the pins on the column to the left of column A.
- Insert the 1mH inductor into the breadboard vertically in the same row as the diode and capacitor.
- Insert the second lead of the inductor vertically in any pin in the same column as the other end of the capacitor.
- Note: There should be three wires in one row of the breadboard. The antenna will be connected here later, so remember this column. Similarly, the other ends of the inductor and capacitor should be in the same row. The ground wire and one of the headphone wires will be connected later, so remember this row.
- Insert one end of the 100kΩ resistor in the same row as the other end of the diode.
- Insert the other end of the resistor into the same column as the ends of the inductor and capacitor.
- Connect one wire from the headphone to the same row as one end of the diode and resistor.
- Connect the other headphone wire to the column that has the ends of the inductor, capacitor, and resistor.
- Connect the antenna located at the front of the lab into the same column as the inductor and the diode.
- Listen for music. In the lab report and presentation, indicate quality and loudness of the music heard from the crystal set.
- After completing the radio, disconnect it from the antenna and ground, and return to the lab to put away the equipment and clean up the work area.


Data Analysis
| Frequency (Hz) | VIN (Volts) | VOUT (Volts) | Gain=20log(VOUT/VIN) (dB) |
|---|---|---|---|
| 10 | 2.0 | ||
| 20 | 2.0 | ||
| 50 | 2.0 | ||
| 100 | 2.0 | ||
| 200 | 2.0 | ||
| 500 | 2.0 | ||
| 1000 | 2.0 | ||
| 2000 | 2.0 | ||
| 5000 | 2.0 | ||
| 10000 | 2.0 |
- Create two tables in Microsoft Excel (one each for the low-pass filter and high-pass filter) to record the data. Remember the VIN is a constant. Each table should look like Table 5.
Instruct Microsoft Excel to calculate the gain using Equation.
- Plot two Gain (Y) vs. Frequency (X) graphs using the Scatter (X, Y) template. Make one graph for each table.
- Find the template on the Insert tab, under the Charts collection, with the Scatter icon. Click on the arrow below or next to the icon and select the top left icon in the pulldown gallery. Get the desired axes by double-clicking on the axis. Additional chart elements, such as labels and titles, can be added by clicking on the chart, which will add a design tab to the ribbon. In the Chart Styles collection, click the icon that looks like the desired graph. Rightclick on the items to be changed.
- Change the x-axis to logarithmic scale.
- Right click on the x-axis and click on Format Axis. Depending on the version, either a dialog window or a sidebar will appear. Look for Logarithmic scale. Click the check box next to this item and click Close.
- Identify each of the circuits as a low-pass or high-pass filter. Find the -3dB point and the cutoff frequency.
The lab work is now complete. Please clean up the workstation. Return all unused materials to a TA. Refer to the Assignment section for the instructions needed to prepare the lab report.
Assignment
Individual Lab Report
Follow the lab report guidelines laid out in the page called Specifications for Writing Lab Reports in the Technical Communication section of this manual. The following points should be addressed in the appropriate section of the lab report:
- What is an oscilloscope? Some research may be required to answer this question
- Discuss the different types of electrical elements. (i.e. resistor, capacitor, inductor)
- Observe the graphs generated from each circuit. What type of filter does each circuit produce?
- Does each circuit produce the expected result? If not, explain why
- Locate the -3dB point and cutoff frequency on each graph to determine the bandwidth of each filter
- What is the -3dB point used for?
- Name the three different types of filters and applications for each
- Discuss any problems encountered; was the experiment a success or a failure? If a failure, why?
- Describe the operation/circuitry of the crystal set
- How does environmental noise affect radios and how could filters be used to help?
- How could the low-pass and high-pass filters be changed and used together to make a band-pass filter?
Remember: Lab notes must be taken. Experimental details are easily forgotten unless written down. EG1004 Lab Notes Paper can be downloaded and printed from the EG1004 Website. Use the lab notes to write the Procedure section of the lab report. At the end of each lab, a TA will scan the lab notes and upload them to the Lab Documents section of the EG1004 Website. One point of extra credit is awarded if the lab notes are attached at the end of the lab report. Keeping careful notes is an essential component of all scientific practice.
Team PowerPoint Presentation
Follow the presentation guidelines laid out in the page called EG1004 Lab Presentation Format in the Introduction to Technical Presentations section of this manual.When preparing the presentation, consider the following points:
- How do the results obtained validate the function of the filters created?
- What are some applications of electronic filters?
- Why is the -3dB point important? What is its significance? How is it determined?
Appendix: How a Crystal Set Works
Note: This material has information about how a crystal set works. This section is not required reading.
History
Some of the earliest radios made were crystal sets. They have a number of advantages:
- They do not require a power source, such as a battery, so they can be used any time. This makes them very valuable during blackouts and recovery from disasters
- They have so few components they can be built quickly, usually out easily obtained parts
- They are rugged because of their simplicity, so they can be used while traveling
- Unlike regular radios, they do not emit a signal, making them excellent stealth radios. This is important to people who must listen to the radio without giving away their position
The radio has several major components:
- An antenna, which should be as long as possible — the longer the antenna, the more stations heard
- An earth ground. As the name implies, this connects the radio to the earth, allowing signals it receives to return to ground to complete the circuit
- A band-pass filter consisting of an inductor and a capacitor. Usually the values of one or both these components can be changed, or varied. For the inductor, if it can be varied, it is by turning a rod going through the middle of the inductor. For the capacitor, if it can be varied, the capacitor plates are visible and can be rotated. Changing these values allows the frequency to be changed, tuning the radio
- A diode is shown in the middle of the circuit diagram. The signal from the band-pass filter would look like a sine function (similar to the low-pass and high-pass filters), but instead of its amplitude being constant, it would change substantially. A typical signal is shown in Figure 21.
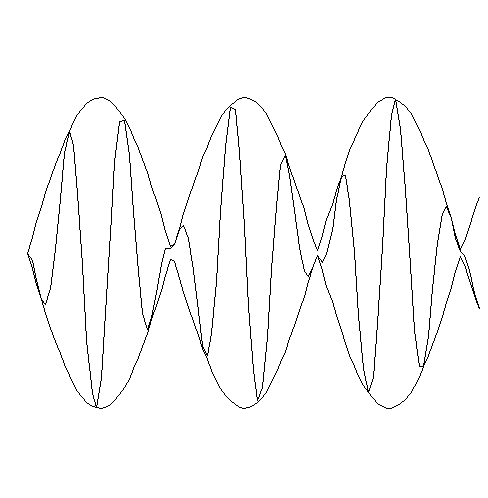 Figure 21: Received signal waveform.
- The variation in the waveform is the desired audio signal (sound) to be heard. This is called amplitude modulation, or AM, for short.
- A diode is a device that passes electrical current in one direction. There are many other materials that can be used as a diode. During World War II, many soldiers used a rusty razor blade as a diode. After the invention of semiconductors, diodes are now made of silicon or germanium. For a crystal set, germanium is a better choice. In electronics in the United States, diodes have names that start with 1N, followed by a number and possibly a letter. The number is a serial number assigned by agreement among the electronics manufacturers. A letter, if present, indicates an improved version of the product. The diode used here is 1N34, but the improved 1N34A could be used as well. Transistors always start with the designation of 2N.
- The diode is used as a detector, which detects the sound from the radio wave. It does this by removing the negative part of the sine wave, leaving only positive voltages. The headphones act as a low-pass filter, seeing only the height of the sine wave rather than the voltage variations of the sine wave itself. This amplitude is the audible audio signal.
- The headphone makes the signal audible. Sometimes a resistor is put in parallel with the headphone to boost the signal.

The negative thing about crystal sets is that they are essentially a craft item. Sometimes they do not work for any apparent reason. Sometimes they work in ways that are not totally understood.
| ||||||||